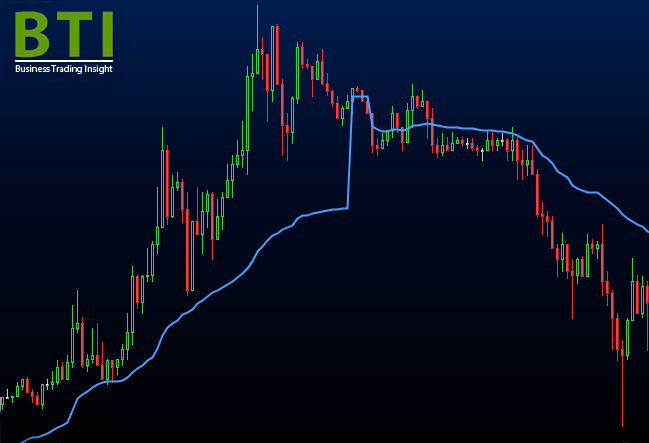
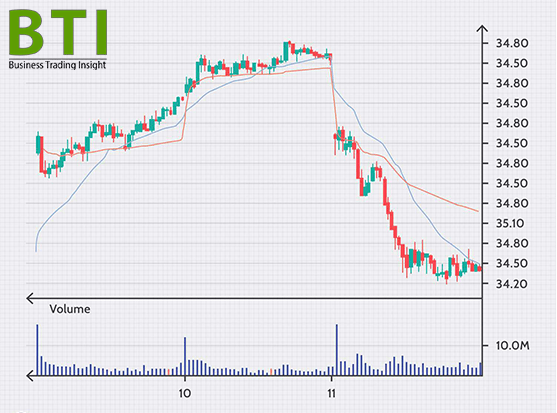
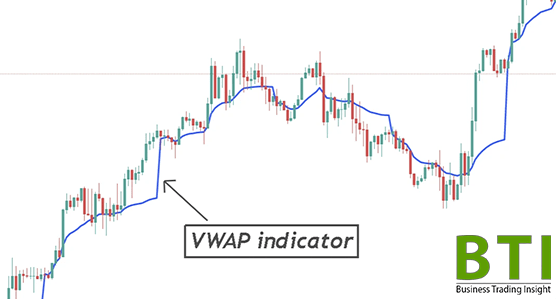
The Volume Weighted Average Price (VWAP) is an important technical indicator that helps traders assess the real value of an asset over a certain period of time. The key difference between VWAP and other indicators is that VWAP considers not only the trade price but also the trading volume, making it a more accurate tool for determining the average asset price. VWAP shows how interested the market is in a particular asset.
VWAP is widely used by both beginner traders and professionals. Its primary function is to provide the average price of an asset, weighted by trading volume. This means that the larger the volume, the more influence the price has on the final VWAP value. Traders use this indicator to determine whether the asset’s price is fair within the context of the current trading activity.
Volume Weighted Average Price (VWAP)
VWAP helps traders understand how much the current market price of an asset deviates from its «true» value. The indicator is particularly useful for gauging overall market sentiment. If an asset’s price is above VWAP, it may suggest the market is overvaluing the asset, which often signals overbought conditions. Conversely, if the price is below VWAP, the asset may be considered undervalued, and traders might view such situations as a good buying opportunity.
This indicator is especially popular among institutional investors because it provides insight into how the market as a whole «sees» the price, rather than focusing on individual trades. This helps avoid buying or selling an asset at an unjustifiably high or low price.

How is VWAP Calculated?
The process of calculating VWAP may seem complex at first, but it is fairly straightforward. To calculate VWAP, you need the price and trading volume for each time interval during the trading day. These could be minute or hourly data, depending on the chosen period of analysis.
Here’s a basic example of the calculation process:
- For each time interval, multiply the transaction price by the trading volume.
- Sum the results for the entire day.
- Divide the total by the overall trading volume for the day.
This process helps determine the average price at which the asset traded during the day, accounting for the volume.
Formula
The formula for calculating VWAP is as follows:

VWAP = (Sum of (Transaction Price * Volume)) / (Sum of Volume).
Each element of this formula has its significance:
- Transaction Price is the current price of the asset at a given time.
- Volume is the amount of the asset bought or sold at that time.
- Sum of Volume is the total volume of trades during the selected period.
Thus, VWAP gives a more accurate representation of an asset’s average price since it considers both price and volume, allowing traders to better navigate the market.
Importance of Volume Weighted Average Price
VWAP is an important tool for traders because it helps understand the true value of an asset based on the trading dynamics. Traders use VWAP to evaluate the asset’s liquidity and fair price over a certain period. The indicator also helps assess the efficiency of trading: if an asset was bought or sold above or below Volume Weighted Average Price, it might indicate successful or unsuccessful trading decisions.
VWAP is also important for determining the overall market trend. It can signal whether an asset is overbought or oversold, helping traders make informed decisions.
We also recommend reading: What is Double Bottom Pattern
How is VWAP Used?
VWAP can be used for various trading strategies. The primary strategy involving VWAP is buying an asset when its price is below the indicator and selling when it’s above. The logic here is simple: if the asset is trading below VWAP, it might indicate it is undervalued, while a price above VWAP may suggest it is overvalued.
Traders also use VWAP to set entry and exit points in a position. For example, if the price moves below VWAP, a trader might consider this a signal to open a long position, expecting the price to rise towards the indicator.

VWAP vs Simple Moving Average (SMA)
The Simple Moving Average (SMA) is another popular indicator, which, like VWAP, is used to analyze an asset’s average price over a period of time. However, SMA is calculated without considering volume, making it less accurate in certain situations.
VWAP provides a more precise understanding of an asset’s average price because it includes trading volume in its calculation, which is especially important in volatile markets. Nevertheless, SMA can be useful in situations where volume is not as significant, and traders only want to gauge the overall trend direction.
Trading with VWAP
Traders can use VWAP as a key indicator for making trading decisions. One way to trade using pattern is to identify levels of support and resistance. If an asset’s price approaches VWAP from below, it might indicate a potential support level, while a move from above towards VWAP could signal resistance.
Institutional investors also use VWAP to optimize the execution of large orders. Since they aim to minimize the impact of their trades on the market, VWAP helps identify the most favorable points for buying or selling an asset.
Limitations of VWAP
Despite its popularity, Volume Weighted Average Price has certain limitations. One of the main ones is its lagging nature. Since VWAP is based on past data, it may not always timely signal market reversals. This makes it less useful for short-term trading, especially in highly volatile markets.
Moreover, VWAP is not suitable for use in shorter time frames, such as minutes or seconds, because the calculations require a large amount of data.

What Does VWAP Show?
VWAP provides traders with information about how the market is valuing an asset over a certain period. It is an indicator of liquidity and market interest in the asset. It also helps determine whether an asset is overbought or oversold.
Additionally, Volume Weighted Average Price helps traders navigate the market by offering signals on when the asset’s price is nearing its fair value.
Is VWAP a Leading Indicator?
VWAP is considered a lagging indicator because it is based on past prices and volumes. This makes it useful for confirming trends but not for predicting them. Traders can use pattern to validate their hypotheses about current trends and the overall market condition, but predicting future price movements requires other tools.

