Technical analysis is the foundation for successful trading in financial markets. Patterns such as the Double Top play a key role in this analysis, allowing traders to predict potential trend reversals. Understanding these patterns not only increases the chances of successful trades but also strengthens traders’ confidence in their decisions. In this article, we will examine the Double Top pattern in detail, its characteristics, and ways to apply it in trading.
What is a Double Top? Definition
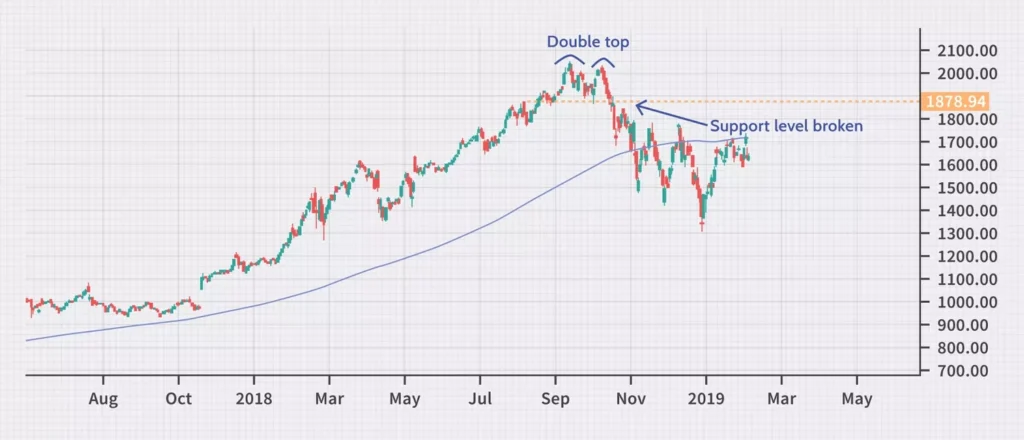
A Double Top is a chart pattern that forms in an uptrend and indicates a potential reversal downward. It consists of two peaks that are approximately at the same level, separated by a trough. This pattern is considered a reliable indicator as it signifies a change in market dynamics.
Key Characteristics of the Pattern
- Two Peaks: The pattern consists of two peaks that should be roughly equal in height, indicating that buyers cannot push the price above a certain level.
- Descending Trough: There should be a clearly defined trough between the two peaks, confirming the struggle between buyers and sellers.
- Volume: Typically, trading volume increases at the first peak as traders actively buy. At the second peak, the volume usually decreases, suggesting weakness in the bullish trend.
Historical Background and Development of the Concept
The Double Top pattern has been recognized since the emergence of technical analysis in the early 20th century. It has become an essential element for many traders and analysts due to its simplicity and effectiveness in predicting market movements. Understanding the historical context of this pattern helps in grasping its significance in modern markets.
What Does Double Top Indicate?
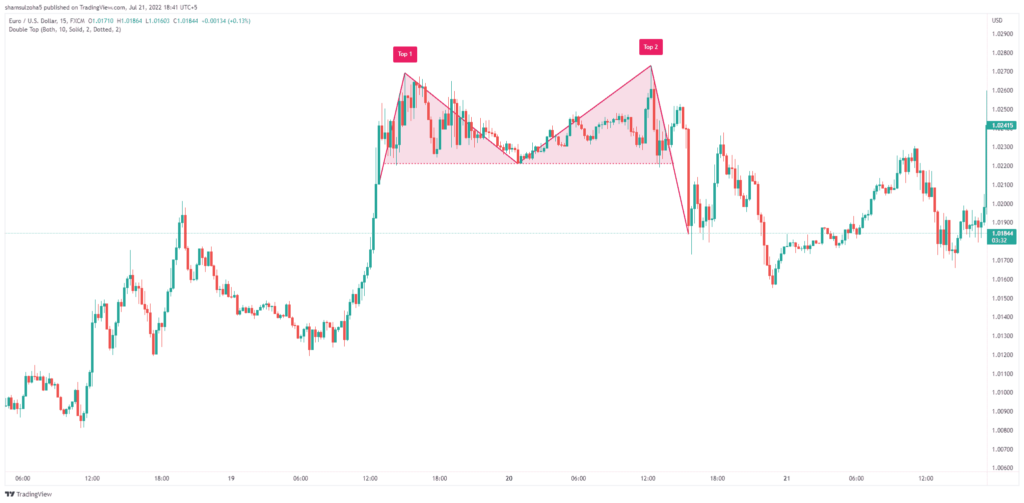
The formation of a Double Top is closely related to trader expectations. At the first peak, many investors start taking profits, causing a temporary slowdown in price growth. At the second peak, when the price reaches the same level again, some traders begin to doubt the continuation of the trend, creating additional downward pressure on the price. This psychological aspect is key to understanding the pattern.
Signals of Potential Trend Reversal
The Double Top pattern is a strong signal that an uptrend may come to an end. Traders interpret it as a warning of a potential price decline, which can lead to significant selling activity. This signal becomes particularly relevant if the price breaks below the support level located under the trough between the peaks.
Influence on Trader Decisions
Traders using technical analysis pay close attention to the Double Top and may decide to sell assets or reduce positions. These actions can reinforce downward movements, further highlighting the significance of the pattern in the context of market dynamics.
Double Top vs. Double Bottom
A Double Bottom is a pattern that forms in a downtrend and signals a potential reversal upward. It consists of two troughs that are approximately at the same level, separated by a peak between them.
Comparison of Patterns: Key Differences
- Trend Direction: The main difference is that a Double Top signals a reversal downward, while a Double Bottom indicates a reversal upward.
- Structure: Both patterns have two key points, but in a Double Top, these are peaks, whereas in a Double Bottom, they are troughs.
How to Use Both Patterns in Strategy
Knowledge of how these patterns function allows traders to combine them in their strategies. For example, if a trader notices a Double Top, it can serve as a signal to open a short position, while the discovery of a Double Bottom may suggest the possibility of opening a long position. This enables effective utilization of both patterns to optimize trading decisions.
How to Identify a Double Top
To identify a Double Top, it is essential to wait for the completion of an uptrend. The pattern forms when the price reaches a certain level and then begins to correct. It is important that the two peaks are close in height and that there is a noticeable trough between them.
Graphic Signs: High Points, Support Level
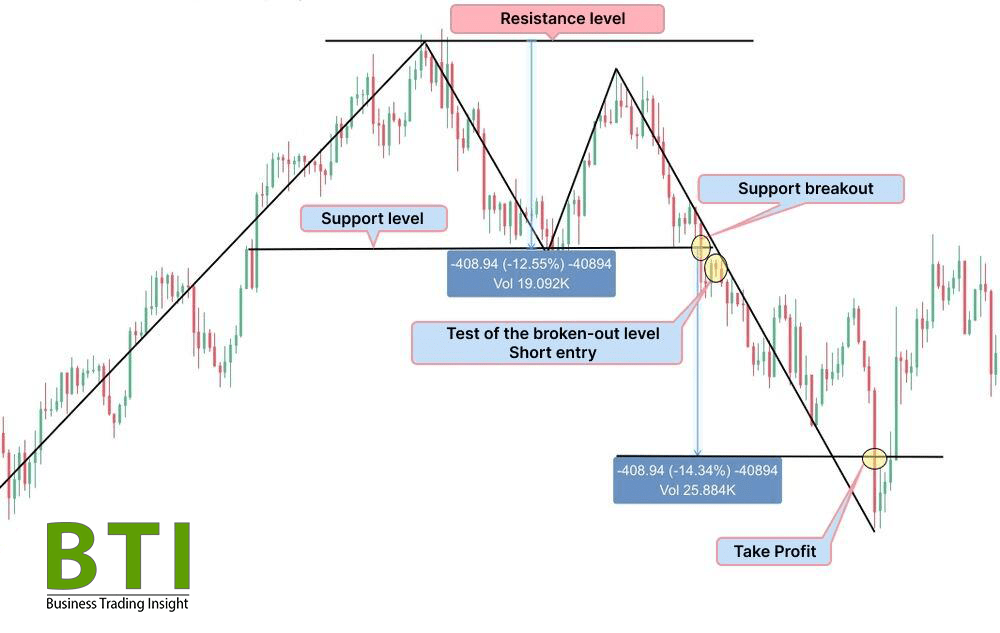
When analyzing the chart, attention should be paid to the two peaks that should be at a similar level. The support level located between them will be an important indicator for further analysis. If the price breaks below this level, it may confirm the strength of the reversal signal.
Examples on Charts for Visualization
Visualizing the pattern on charts can greatly simplify its identification. Traders can use technical analysis platforms to track the formation of the Double Top and make decisions based on visually presented data.
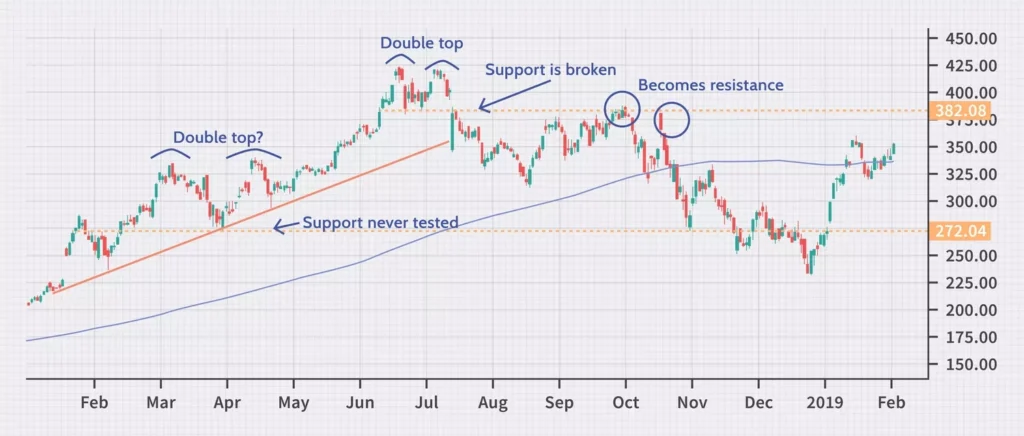
Key Elements of Double Top
The two peaks are fundamental elements for the formation of the pattern. The resistance level is a horizontal line drawn through the peak levels, indicating a boundary where the price encounters selling pressure.
Trading Volume: Its Significance in Confirming the Pattern
Trading volume is another critical factor when analyzing a Double Top. An increase in volume at the first peak can signal strong interest from traders. If volume decreases at the second peak, it indicates waning buying pressure, which may confirm the likelihood of a reversal.
Time of Formation: How It Affects Signal Reliability
The duration of the Double Top’s formation is also important for signal reliability. The longer the pattern takes to form, the more significant it becomes. This is because traders have more time to assess the situation, leading to a more accurate reflection of their expectations in the price.
How to Trade Based on Double Top
Traders who notice the formation of a Double Top often use strategies for entering short positions. It is advisable to open such positions after the price breaks below the support level that is lower than the trough. This provides a signal that the uptrend may indeed be coming to an end.
Setting Stop-Loss and Target Levels
It is crucial to set stop-loss orders just above the resistance level to minimize potential losses in case of a false signal. Target levels can be calculated based on the height of the pattern, allowing traders to determine the potential downward movement.
Risk Management Recommendations
Risk management is a key aspect of successful trading. It is recommended not to risk more than 1-2% of the capital on a single trade. This helps to avoid significant losses and maintain the ability to trade in the future.

Advantages and Disadvantages of Using Double Top
Advantages:
- Simplicity of Identification: This pattern is easily recognizable on charts, making it accessible to traders of all levels.
- High Predictability: The Double Top often provides accurate signals about potential trend reversals, making it a useful tool in a trader’s arsenal.
Disadvantages:
- False Signals: Like any other pattern, the Double Top is not immune to false signals. Sometimes the price may temporarily retrace before continuing its movement.
- Not Always Confirmed by Volume: Volume may not always confirm the formation of the pattern, increasing risks for traders.
Recommendations for Risk Minimization
To reduce risks, traders can use additional indicators and analysis methods. For example, combining volume analysis with oscillators or trend lines can enhance the accuracy of signals.
The Double Top pattern is a powerful tool for traders looking to improve their skills in technical analysis. Understanding its structure, characteristics, and application can significantly increase the likelihood of successful trades. It is advisable not to limit oneself to just one pattern but to study other elements of technical analysis to create a comprehensive trading strategy.


