Double bottom patterns are essential formations in technical analysis that indicate potential bullish reversals. These patterns occur after a downtrend and suggest that selling pressure has waned, providing a critical opportunity for traders to capitalize on an impending upward movement. By understanding double bottoms, traders can better anticipate market behavior and enhance their decision-making processes.
What Are Double Bottom Patterns?
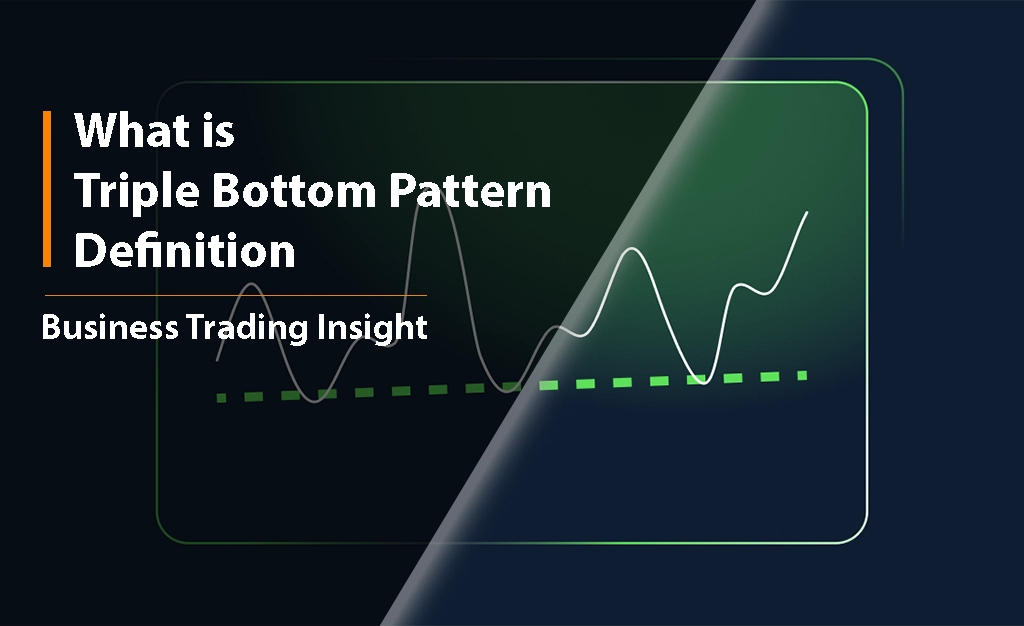
A double bottom pattern is characterized by two distinct lows at approximately the same price level, separated by a peak. This formation typically appears after a significant decline in price, indicating that the asset may be transitioning from a bearish trend to a bullish trend. The pattern is visually represented as a «W» shape on price charts, where the two lows represent points of support.
Characteristics
The key features of a double bottom include:
- Two Distinct Lows: The price drops to a low point, rebounds to form a peak, and then falls again to a similar low before potentially rising. This structure reinforces the notion that buyers are stepping in at the lower price levels, creating support.
- Peak: The peak between the two lows should ideally not exceed the price of the lows significantly, as it represents the point where selling pressure temporarily outweighed buying interest.
- Timeframe: While double bottoms can appear on various timeframes, they are most commonly analyzed on daily or weekly charts to capture significant market trends.
- Market Conditions: These patterns often arise in volatile markets or following prolonged downtrends, indicating that the selling pressure may be exhausted and that a bullish reversal could be on the horizon.

What Does a Double Bottom Tell You?
Market Sentiment
A double bottom pattern indicates a critical shift in market sentiment. The formation of two lows suggests that sellers are losing their grip, while buyers are beginning to enter the market, creating upward pressure. This transition can lead to increased confidence among traders, resulting in more buying activity as the sentiment shifts from bearish to bullish.
Trend Reversal Indicator
As a strong reversal signal, the double bottom pattern highlights a potential change in trend direction. Historical data supports its reliability; many successful double bottom formations result in significant upward price movements, making them a valuable tool for traders seeking to identify turning points in the market.
Identifying Double Bottom Patterns
Key Identification Criteria
To effectively recognize a double bottom, traders should look for:
Two Distinct Lows: Both lows should be at approximately the same price level, signaling strong support.
A Noticeable Peak: The peak between the lows must be evident, demonstrating the resistance level that buyers must overcome.
Increasing Volume on the Second Low: An increase in trading volume during the upward move after the second low is a positive confirmation of buying interest.

Visual Indicators
When analyzing charts, traders should focus on:
- Support Levels: Identify horizontal support around the lows, which can be a potential entry point.
- Resistance Levels: Observe the peak level that must be breached for a bullish confirmation.
- Volume Trends: Look for volume spikes during the upward movement following the second low, which can validate the pattern.
Tools for Identification
Several tools can aid traders in identifying double bottoms:
- Charting Software: Utilize advanced charting platforms that offer candlestick analysis to visualize patterns clearly.
- Technical Indicators: Employ moving averages, RSI (Relative Strength Index), and MACD (Moving Average Convergence Divergence) to confirm trends and identify bullish signals.
- Alerts and Notifications: Set alerts on trading platforms for price movements near identified support and resistance levels.
Example of a Double Bottom
Visual Representation
A classic double bottom formation appears as a «W» shape on price charts. The first low signifies the initial sell-off, the peak represents resistance, and the second low confirms the support level.
Real-World Example
For instance, consider the stock of XYZ Corp, which declines to $50, rebounds to $60 (the peak), and then falls again to $50 before rising sharply to $70. This sequence illustrates a double bottom pattern, indicating strong buying pressure at $50 and a potential bullish trend as the price breaks above the peak at $60.
How to Trade Double Bottom Patterns
Entry Strategies
Once a double bottom is confirmed, traders can adopt various entry strategies:
Entering on Confirmation: Enter a long position when the price breaks above the peak following the second low, signifying a potential trend reversal.
Limit Orders: Place buy orders slightly above the peak to capture the breakout while minimizing entry risk.
Setting Stop-Loss Orders
To manage risk effectively, it is advisable to set stop-loss orders below the recent low of the double bottom. This safeguards against potential false breakouts and unexpected market movements. A common practice is to place the stop-loss about 2-3% below the lower low.
Take-Profit Levels
Setting realistic profit targets is essential for successful trading:
- Using Prior Resistance Levels: Set take-profit orders at previous resistance levels identified on the chart to secure gains.
- Risk-to-Reward Ratios: Aim for a minimum risk-to-reward ratio of 1:2 or 1:3. For example, if the stop-loss is set at 2% below the entry point, the take-profit target should ideally be set at least 4-6% above the entry.
What Happens After a Double Bottom Pattern?
Expected Price Movements
After forming a double bottom, the price typically experiences an upward movement, indicating a bullish trend. However, traders should remain vigilant for potential pullbacks or corrections.
Continuation or Reversal
Price movements can vary after a double bottom:
- Continuation: A strong breakout above the peak can lead to sustained upward momentum, providing opportunities for long positions.
- Pullbacks: In some instances, the price may pull back after the initial breakout, creating opportunities to enter at a more favorable price point.

Double Top Patterns vs. Double Bottom Patterns: What’s the Difference?
Definitions and Characteristics
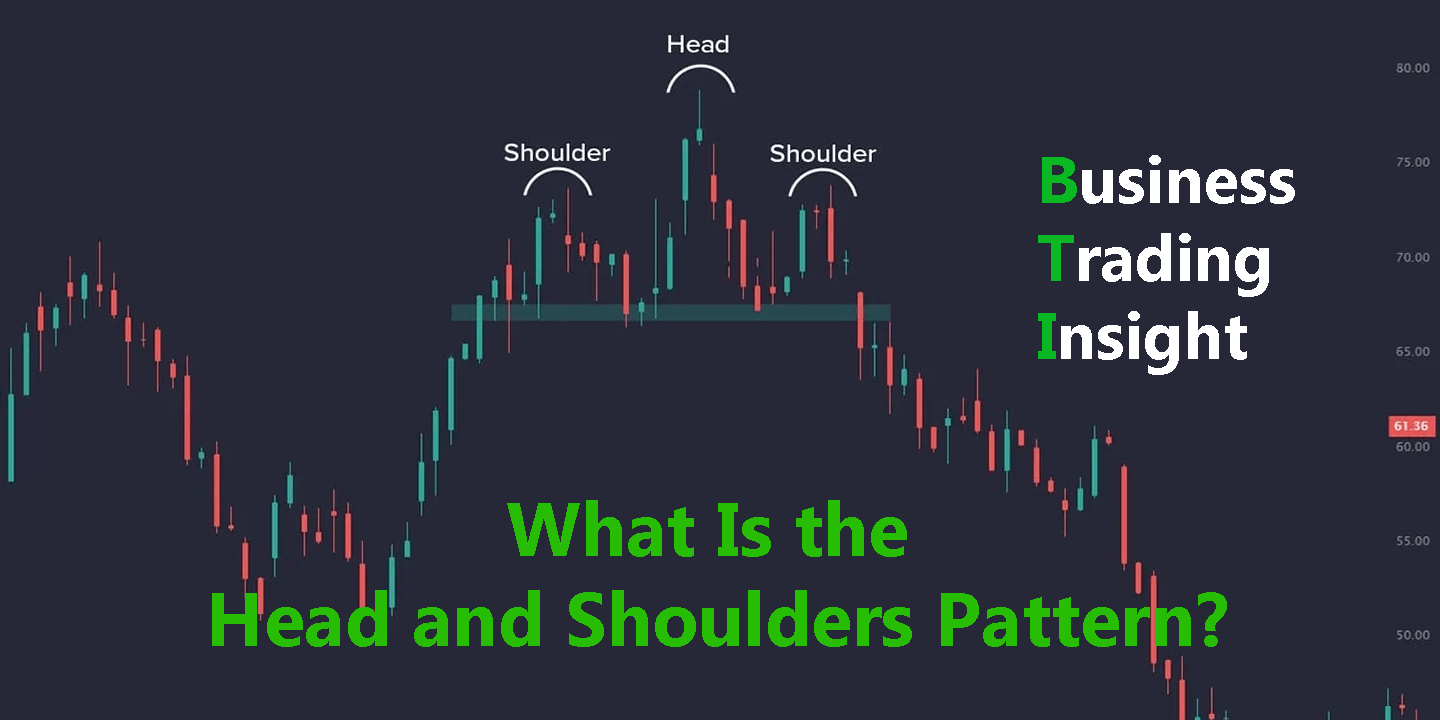
Double top and double bottom patterns are opposites in terms of market direction. A double top indicates a bearish reversal after an uptrend, while a double bottom signifies a bullish reversal after a downtrend. Understanding these patterns’ nuances is vital for effective trading.
Implications for Traders
Traders must differentiate between the two patterns to adjust their strategies effectively. Recognizing the context and market conditions is crucial for making informed trading decisions, as both patterns indicate potential reversals but suggest opposing actions.
Must the Two Bottoms of the Lows in the Double Bottom Pattern Be the Same?
Analysis of Price Levels
While it is preferable for the two lows to be similar in price, it is not strictly necessary. Variations in price levels can still yield a valid double bottom as long as the overall pattern remains intact.
Impact on Pattern Validity
Though identical lows enhance the pattern’s reliability, differing levels can indicate strong buying interest, suggesting potential upward movement. Traders should assess the pattern’s context and the overall market sentiment rather than focusing solely on price equality.

What Is the Overall Interpretation of a Double Bottom?
Market Context
Interpreting a double bottom pattern requires considering other technical indicators and market conditions. Analyzing broader trends, volume, and external factors (such as economic news) can provide additional insights into the pattern’s implications.
Long-term vs. Short-term Analysis
Double bottoms can influence trading strategies differently based on time horizons. Short-term traders may capitalize on quick price movements, while long-term investors might use the pattern to inform strategic investments, positioning themselves for sustained growth.
Does the Double Bottom Suggest a Price Target?
Target Calculation Methods
To set price targets after identifying a double bottom, traders can use:
- Distance Measurement: Measure the distance between the lows and the peak, then project this distance upward from the breakout point to determine the target.
- Previous Highs: Look for previous high points in the price action as potential targets for profit-taking.
Risk-to-Reward Considerations
Evaluating the risk-to-reward ratio is essential when trading double bottoms. Aiming for a minimum ratio of 1:2 ensures that potential gains justify the risks taken, enhancing overall trading success. For instance, if the stop-loss is set 2% below the entry, the take-profit target should be at least 4% above the entry.


