Bullish Engulfing Pattern: A Key Reversal Signal for Traders
The Bullish Engulfing pattern is one of the most powerful and widely recognized reversal signals in technical analysis. It occurs when a small bearish candle (typically red) is followed by a large bullish candle (green) that completely engulfs the body of the previous candle, signaling a potential shift from a downtrend to an uptrend. In this article, we will delve deeper into how to recognize and interpret this pattern, how to use it effectively in your trading strategy, and how to combine it with other indicators and volume analysis for better results.
What is the Bullish Engulfing Pattern?
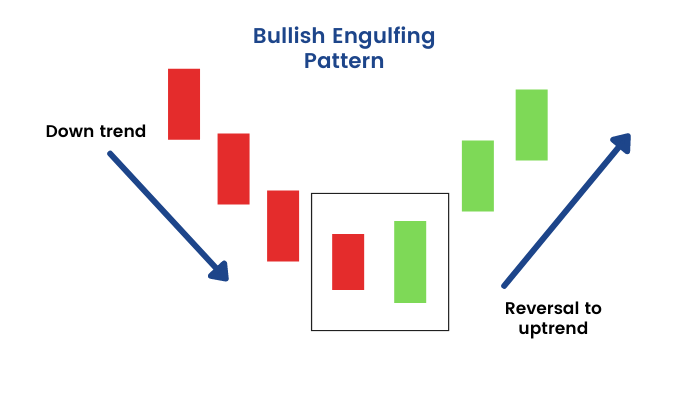
The Bullish Engulfing pattern consists of two candles. The first candle is a small bearish one, indicating some selling pressure, while the second is a large bullish candle that fully engulfs the body of the first, suggesting a sudden shift in market sentiment. This pattern is usually seen at the end of a downtrend, indicating a potential reversal in market direction.
Why is the Bullish Engulfing Pattern Important?
This pattern is valuable because it suggests that buyers are starting to regain control after a period of selling pressure. The Bullish Engulfing pattern reflects a change in sentiment: the previous selling momentum is overwhelmed by new buying activity, and traders often interpret this as a signal to enter long positions, anticipating an upward move in the market.
However, while the pattern is widely regarded as a strong signal, it’s essential to confirm it with volume analysis and other technical indicators for higher reliability. In the next sections, we will explore how volume and key indicators such as RSI and MACD can be used to validate the signal.
How to Recognize the Bullish Engulfing Pattern
To identify a Bullish Engulfing pattern, look for these two key characteristics:
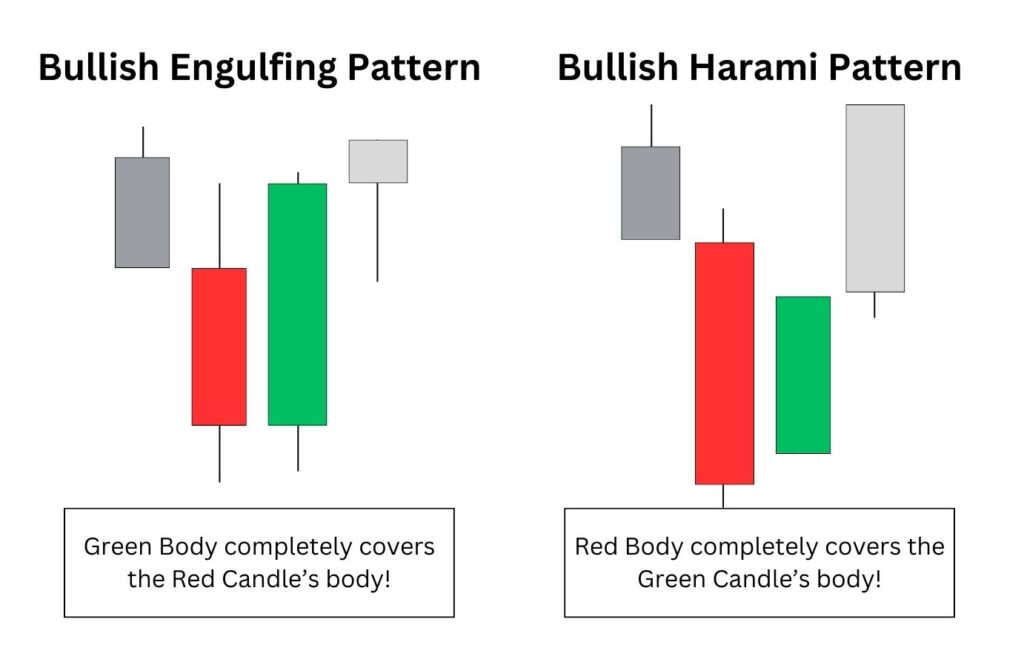
- First Candle: A small bearish candle, suggesting selling pressure. This candle’s body closes lower than its opening price.
- Second Candle: A large bullish candle that completely engulfs the body of the first candle, closing significantly higher than its opening price.
When these two candles form at the end of a downtrend, the pattern signals a shift in sentiment, from bearish to bullish, and often marks the beginning of an uptrend.
Example in Practice
Imagine a stock chart of XYZ Corp. After a prolonged downtrend, the price closes lower with a small red candle. Immediately afterward, a large green candle appears that fully covers the red candle’s body. This is a Bullish Engulfing pattern, signaling that buyers are taking control. Traders might interpret this as a signal to buy, expecting the price to rise in the upcoming trading sessions.
For added confidence in the pattern, look for an increase in trading volume accompanying the bullish candle. Volume analysis plays a key role here: a significant rise in volume supports the validity of the signal, suggesting that more participants are entering the market.
Volume: Key to Confirming the Bullish Engulfing Pattern
Volume is one of the most crucial factors when confirming any candlestick pattern, including the Bullish Engulfing. If the second candle appears with higher volume, this reinforces the signal that buying pressure is strong enough to reverse the prevailing trend. In contrast, low volume can signal that the reversal may be weak, and the pattern could fail.
Volume Considerations in Practice
Consider this example: A Bullish Engulfing pattern forms on a stock chart, but the volume is below average. In this case, even though the candlestick pattern appears valid, the lack of volume might suggest a weak reversal. Traders might want to wait for further confirmation or enter the trade with a tighter stop loss, in case the pattern does not hold.
The Psychology Behind the Pattern
Understanding the psychology of market participants is key to interpreting the Bullish Engulfing pattern. The first candle reflects the control of the sellers, as they are pushing the price lower. However, when the second, larger bullish candle forms, it signals that buyers have entered the market, overpowering the sellers and driving prices higher. This shift in momentum is a psychological signal that a reversal might be in play.
This shift is often accompanied by an increase in volume, which further validates the pattern. However, traders should always be cautious of false signals, particularly in strong trending markets, and always look for additional confirmation.
Combining the Bullish Engulfing Pattern with Technical Indicators
While the Bullish Engulfing is a potent pattern, confirming it with other technical indicators like RSI (Relative Strength Index) and MACD (Moving Average Convergence Divergence) can increase the accuracy of the signal.
Using RSI to Confirm the Bullish Engulfing
The RSI is a momentum oscillator that measures the speed and change of price movements. It ranges from 0 to 100 and is typically used to identify overbought or oversold conditions.
- When RSI is in the oversold region (below 30) and a Bullish Engulfing pattern forms, it strengthens the likelihood of a genuine reversal. In this scenario, the market has been oversold, and the Bullish Engulfing suggests that buyers are stepping in to drive the price higher.
- Example: Imagine the RSI is at 28 when a Bullish Engulfing pattern forms. This confirms that the market is oversold and that the shift in momentum is likely to result in a strong upward move.
Using MACD to Confirm the Bullish Engulfing
The MACD is another popular indicator that can be used to confirm a Bullish Engulfing pattern. It consists of two moving averages: the MACD line and the Signal line. When the MACD line crosses above the Signal line, it indicates a shift to bullish momentum.
- When the MACD crosses from negative to positive around the same time a Bullish Engulfing pattern forms, it reinforces the likelihood of a trend reversal. This crossover suggests that the market is moving from bearish to bullish momentum.
- Example: If a Bullish Engulfing pattern forms, and at the same time, the MACD line crosses above the Signal line, this is a strong confirmation that the reversal is likely to be sustained.
Potential Pitfalls: When the Bullish Engulfing Might Fail
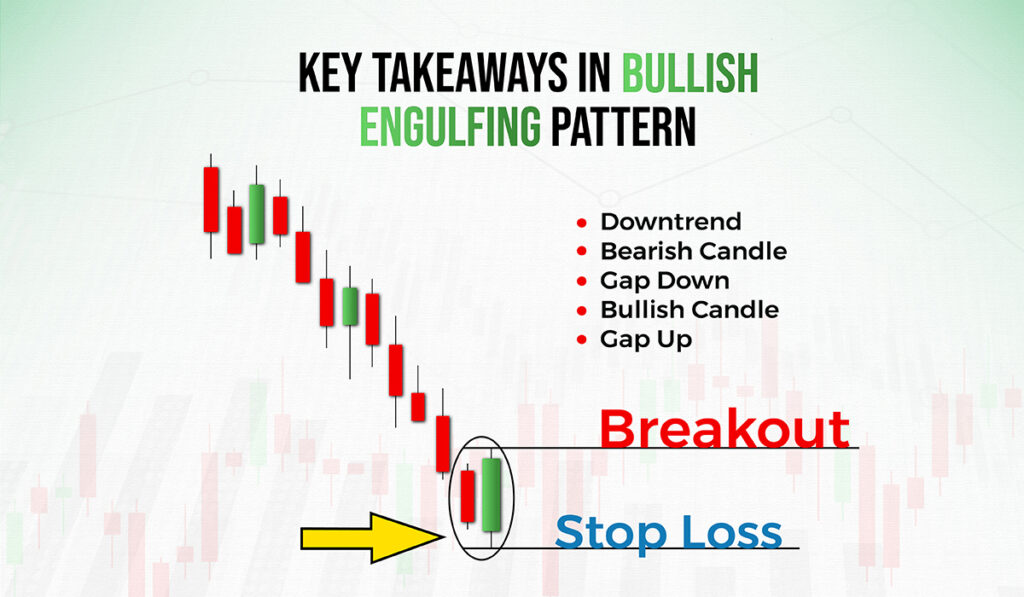
While the Bullish Engulfing is a strong pattern, it is not foolproof. Several factors can lead to failure, and it’s crucial to be aware of them:
- Low Volume: As mentioned earlier, if the Bullish Engulfing pattern forms on low volume, it may indicate a lack of conviction in the price move, and the reversal could fail.
- Market Context: In a strong, overarching bearish trend, even a well-formed Bullish Engulfing pattern might not be enough to reverse the trend. Traders should consider the broader market context and assess whether the downtrend is likely to continue.
- Macroeconomic Events: External factors such as economic reports, corporate earnings announcements, or changes in interest rates can dramatically affect market sentiment. A Bullish Engulfing pattern may not hold if negative news is released right after it forms.
Example of a Failed Bullish Engulfing
Imagine a Bullish Engulfing pattern appearing on the chart of XYZ Corp., but the overall market sentiment is strongly negative due to a major economic report indicating a slowdown in growth. In this case, the pattern might be rendered less effective, and the price could continue to fall, despite the bullish signal from the candles.
Conclusion
The Bullish Engulfing pattern is a powerful tool in technical analysis that can signal potential trend reversals, particularly when confirmed by volume and other indicators like RSI and MACD. By understanding the psychology behind the pattern and using complementary tools to validate the signal, traders can improve their chances of making profitable trades.
However, it is essential to remember that no pattern is foolproof. Macroeconomic factors, market sentiment, and volume play crucial roles in determining whether a signal will result in a successful trade. Always use risk management strategies and confirm the signal with multiple factors to ensure a higher probability of success.
Glossary for Beginners:
- Bullish Candle: A green candle where the closing price is higher than the opening price.
- Bearish Candle: A red candle where the closing price is lower than the opening price.
- Engulfing: When the second candle fully covers or engulfs the body of the first candle.
- RSI (Relative Strength Index): A momentum oscillator that measures the speed and change of price movements.
- MACD (Moving Average Convergence Divergence): A trend-following momentum indicator that shows the relationship between two moving averages of a security’s price.
FAQ
How do I recognize the Bullish Engulfing pattern
Key characteristics of the pattern:
- First candle: A small bearish (red) candle, indicating selling pressure. This candle closes lower than it opened.
- Second candle: A large bullish (green) candle, which fully engulfs the body of the first candle. It closes higher than its open, indicating strong buying pressure.
When these two candles form at the end of a downtrend, it often signals a shift from bearish to bullish market sentiment.
Can the Bullish Engulfing pattern fail?
Yes, under certain conditions:
While the Bullish Engulfing pattern is a strong reversal signal, it can fail in the following situations:
- Low volume: If the pattern forms on low trading volume, it may indicate weak buying interest, making the reversal less reliable.
- Strong bearish trend: In a strong overall bearish market, even a valid Bullish Engulfing pattern might not be enough to reverse the trend. Additional confirmation is needed.
- Macroeconomic factors: Negative news or external events can override the signal, causing the price to continue in the same direction.
Why is volume important in confirming the Bullish Engulfing pattern?
Volume is a critical factor in confirming the validity of a Bullish Engulfing pattern. When the pattern forms with higher-than-average volume, it suggests that the buying pressure is strong and may support a sustained reversal.
- High volume: Increases confidence that the market sentiment is shifting, as more traders are participating in the price move.
- Low volume: May signal that the reversal is weak or unsustainable, reducing the pattern's reliability.
How can I use RSI to confirm a Bullish Engulfing pattern?
The Relative Strength Index (RSI) is useful in confirming the Bullish Engulfing pattern, especially if the RSI is in the oversold region (below 30).
- When the RSI is below 30 and a Bullish Engulfing pattern forms, it strengthens the likelihood of a genuine reversal, as the market has been oversold and buyers are likely stepping in.
- Example: If the RSI is at 28 when the Bullish Engulfing pattern forms, it signals that the market is oversold, and the reversal could be more substantial.
