The Tweezer Bottom Pattern is one of the most powerful reversal signals in technical analysis, providing traders with clear indications of a potential bullish trend shift. Understanding this pattern and knowing how to trade it effectively can significantly enhance your trading strategy. In this detailed guide, we will explore the Tweezer Bottom in depth, examining its characteristics, how to spot it on charts, its significance in market psychology, and how to incorporate it into a robust trading strategy.
What is the Tweezer Bottom Pattern?
The Tweezer Bottom is a candlestick formation that signals a potential trend reversal from bearish to bullish. It typically appears after a downtrend and consists of two candlesticks with similar lows, forming a double-touch support pattern. These candlesticks usually have long lower shadows and small bodies, indicating a struggle between buyers and sellers at a key support level. This pattern is considered a reliable signal that the market is testing its support and may soon reverse its direction.
The formation suggests that the price has reached a level where selling pressure has subsided and buying pressure is beginning to outweigh the sellers. This price action indicates that the market might be ready to move higher. The Tweezer Bottom Pattern is a powerful signal of market sentiment shifting from pessimism to optimism, offering traders a valuable tool for spotting the beginnings of a bullish trend.
Why Is It Important?
For traders, the Tweezer Bottom is significant because it represents a moment of market indecision, where the sellers have tested a support level but failed to push the price lower. This failure indicates that buying pressure is starting to outweigh selling pressure, potentially leading to a price reversal. Identifying this pattern helps traders make informed decisions about entering long positions at the start of a new bullish trend.
The formation is particularly useful for swing traders and short-term traders, as it provides a clear entry point after a sustained downtrend. Investors can also use it to time entries for longer-term bullish trends, especially when combined with other technical indicators and analysis tools.
Overview of Chart Patterns
The Tweezer Bottom belongs to the broader family of reversal chart patterns, which are designed to signal shifts in the prevailing trend. Patterns like the Double Bottom, Head and Shoulders, and the Tweezer Bottom all aim to identify trend changes, but they differ in structure, market psychology, and reliability. While the Double Bottom is a well-known reversal pattern that requires a substantial price movement and two distinct lows, the Tweezer Bottom is a subtler formation that appears at key support levels and relies on candlestick formations to indicate a trend reversal.
Understanding where the Tweezer Bottom Pattern fits within the context of technical analysis is crucial for its effective use in trading strategies. It is important to consider how it works alongside other patterns like the Double Bottom, Hammer, or even the Inverse Head and Shoulders to form a comprehensive technical analysis toolkit. By doing so, traders can more confidently anticipate market moves and improve their decision-making process.
2. Understanding the Tweezer Bottom
What Exactly Does It Represent?
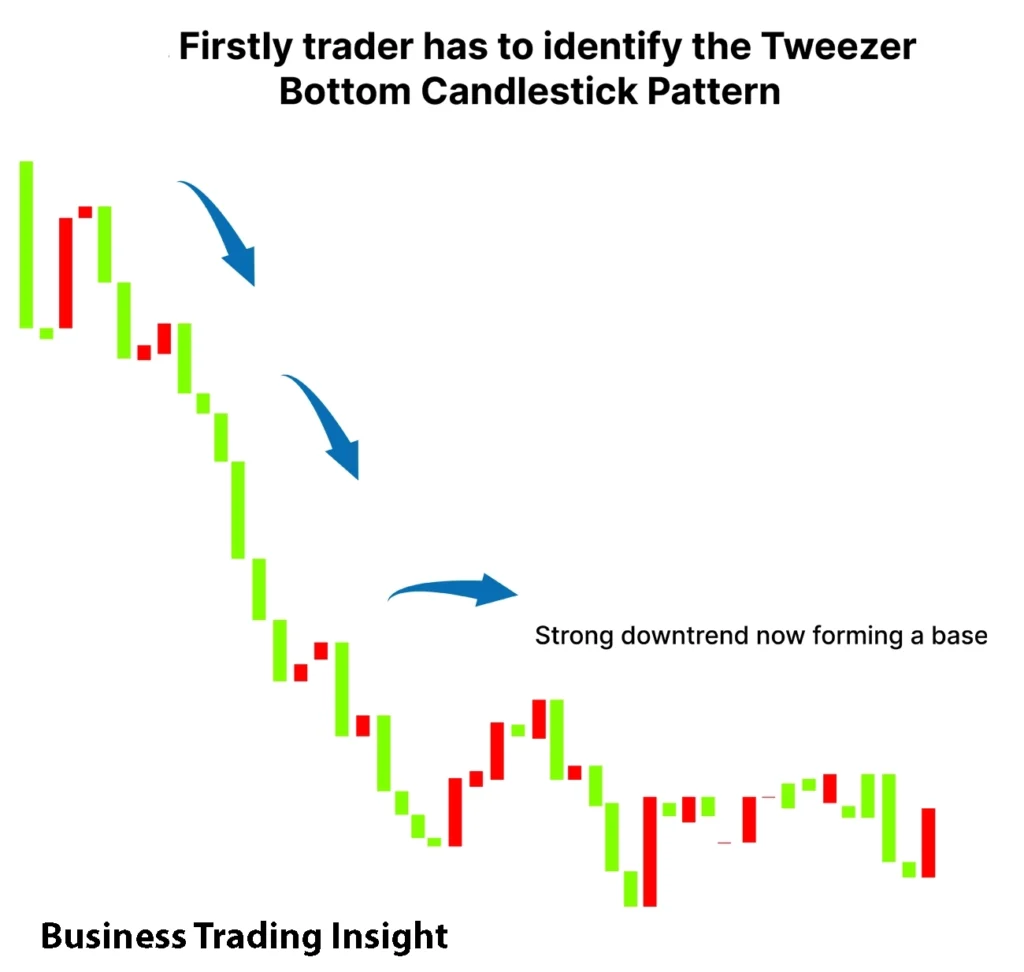
The Tweezer Bottom represents a test of support levels by the market. During a downtrend, the price moves lower until it reaches a support area. Sellers attempt to push the price down further, but the buying pressure at the same level is strong enough to prevent further decline. The pattern forms when the price reaches the same support level twice, signaling that the market has tested the support area and failed to break through.
The formation suggests that the trend of lower prices has exhausted itself, and the market may soon reverse direction. Traders view this as a sign that sellers are losing control and buyers are beginning to take over, which can lead to a shift in market sentiment from bearish to bullish.
In essence, the pattern indicates the market’s struggle between buyers and sellers at a critical price level. It suggests that buyers are gaining strength and may soon overpower the sellers, leading to an upward price movement. This shift is often the beginning of a new bullish phase.
Form and Structure
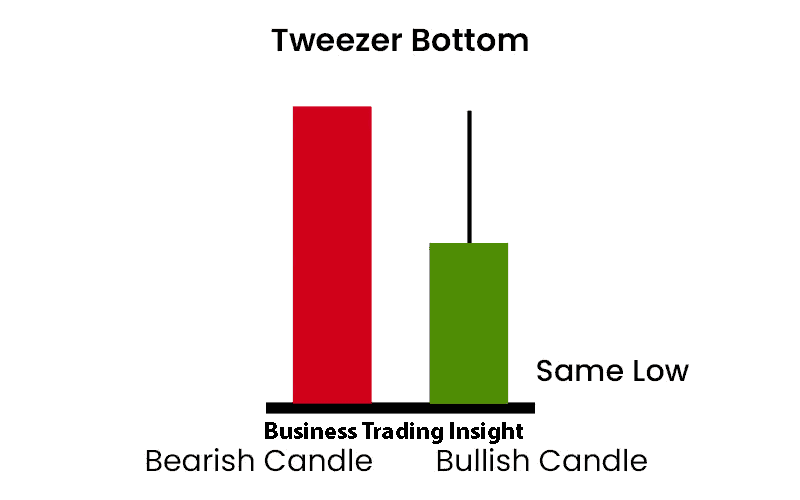
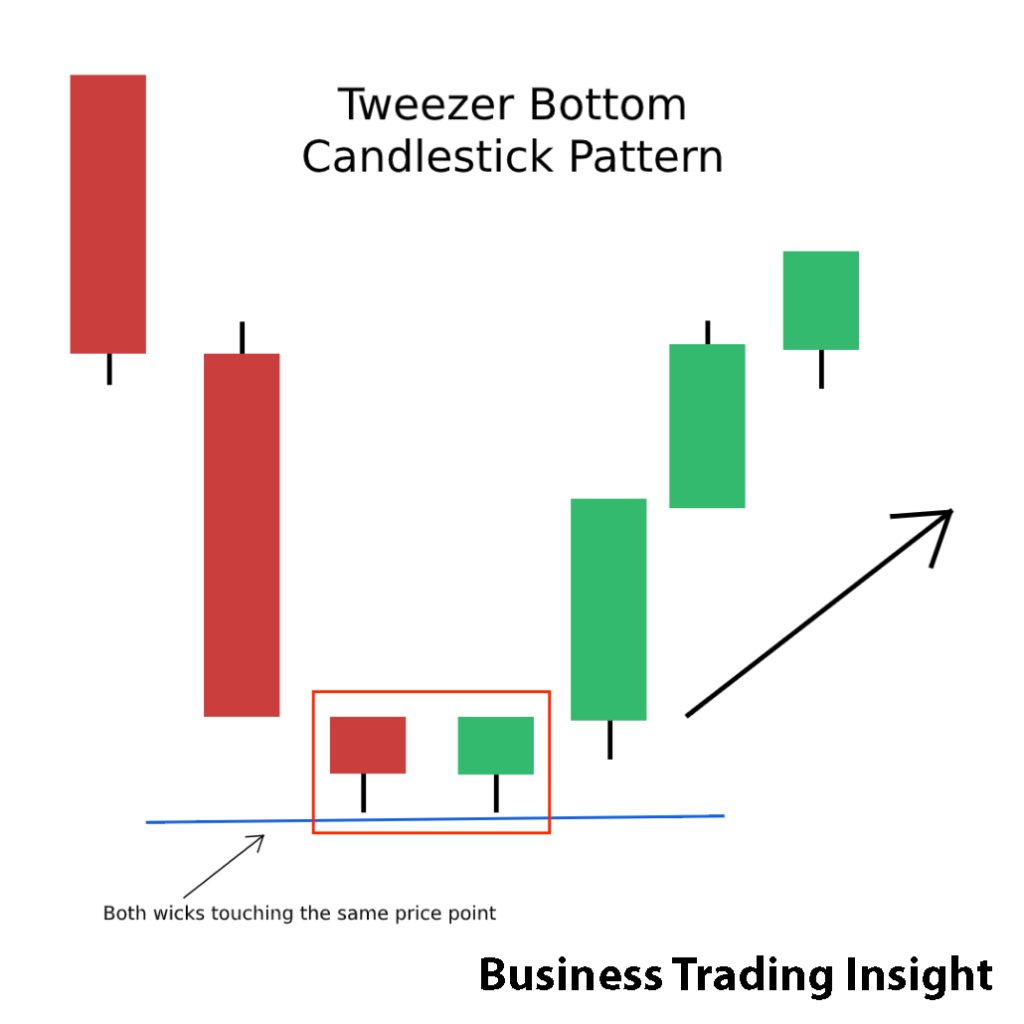
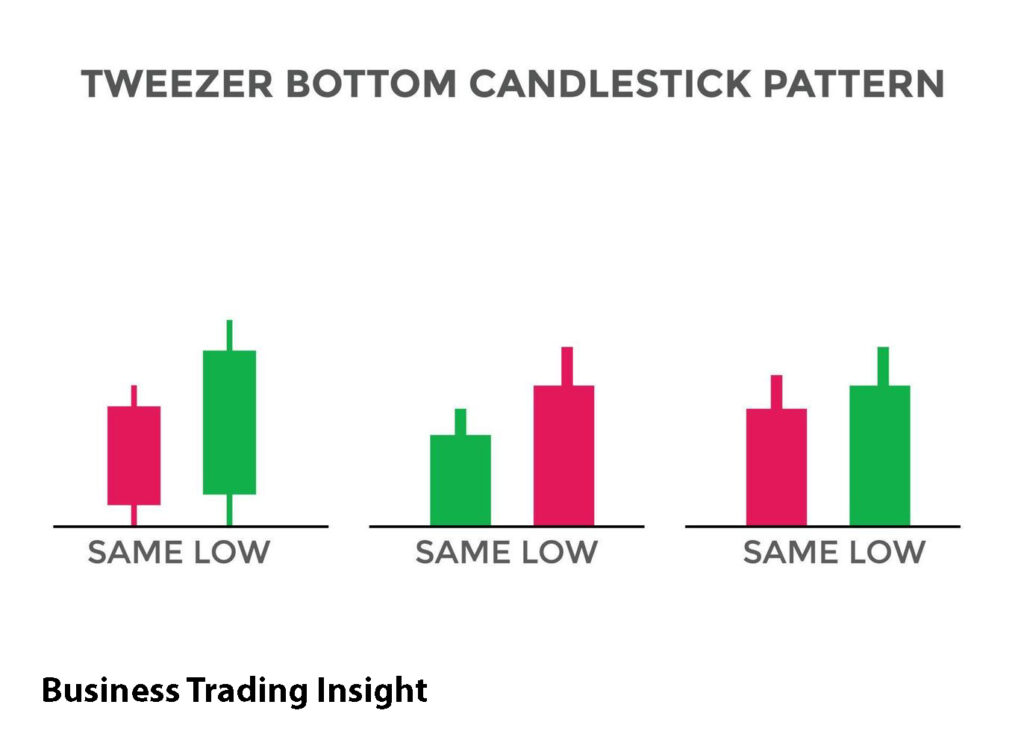
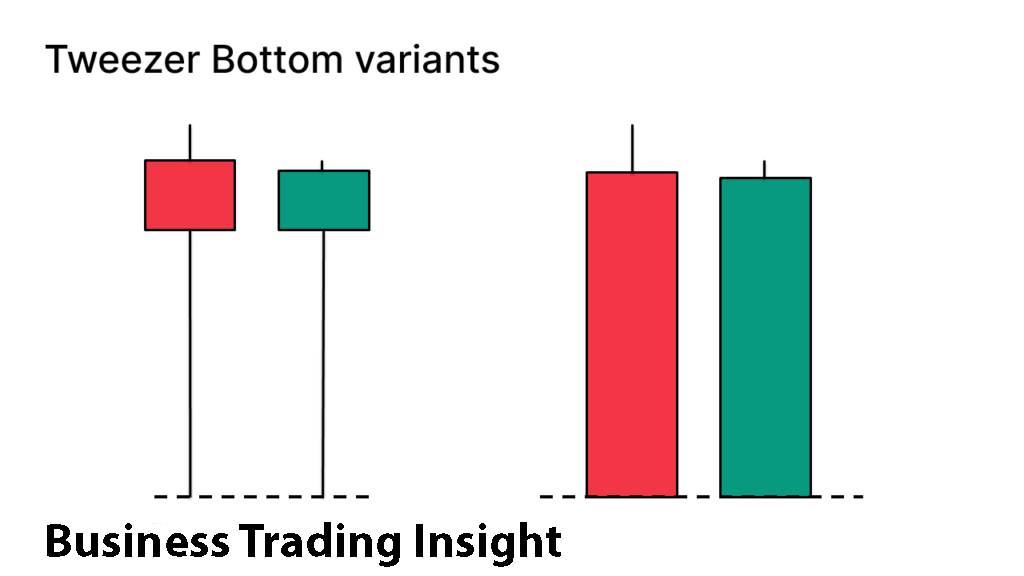
Visually, the Tweezer Bottom consists of two candlesticks with similar lows. These candlesticks often have long lower shadows, indicating that the price attempted to move lower but was rejected by support. The bodies of the candles are usually small, showing indecision in the market. The two lows should be at approximately the same level, forming a double reversal at the same price level.
A critical aspect of the Tweezer Bottom is the symmetry of the two lows. While the exact shapes and sizes of the candlesticks can vary, the lows must be nearly equal in price for the pattern to be valid. This symmetry is crucial because it indicates that the price has found a solid support level that has held firm twice.
Candlestick shape and structure are key to understanding the formation. A pattern with very similar candlesticks and long lower shadows suggests that the market has tested a support zone multiple times and failed to push lower, signaling that the bearish trend is likely over.
Timeframe Considerations
The Tweezer Bottom can form on any timeframe, but its significance increases on higher timeframes such as daily or weekly charts. While it may appear in shorter timeframes, the pattern is more reliable on longer timeframes. Shorter timeframes are more prone to false signals due to market noise and volatility.
On higher timeframes, the pattern is more likely to indicate a true reversal because it has more time to develop and is less influenced by short-term fluctuations. Traders often look for it on daily or weekly charts because these timeframes provide a clearer picture of market sentiment and trend direction.
Moreover, the significance of the Tweezer Bottom Pattern can vary depending on the overall market context. For example, in an oversold market, this formation can be a particularly strong reversal signal, as it suggests that the price has tested a key support level multiple times without breaking it.
3. Key Features and Characteristics of the Tweezer Bottom
Identifying the Tweezer Bottom
To identify a Tweezer Bottom, the pattern must meet several criteria. First, there should be a clear downtrend preceding its formation. This downtrend sets the stage for the pattern, showing that selling pressure has dominated the market. Second, two candlesticks must form with matching bottom points at approximately the same level, signaling the market’s test of support.
The two candlesticks that make up the formation should have long lower shadows, which indicate that the price attempted to move lower but was rejected by support. The bodies of the candles are typically small, showing indecision in the market. This behavior suggests that neither buyers nor sellers have full control, but buyers are beginning to take over after the second test of support.
Candlestick Behavior
The candlesticks in this formation are often characterized by long lower shadows and small bodies. The long shadows represent the rejection of lower prices, while the small bodies indicate market indecision. This combination of candlestick characteristics suggests that the market is at a crossroads, with neither buyers nor sellers in full control.
The Tweezer Bottom is typically formed by two candlesticks with similar shapes, though there may be slight variations. A valid pattern does not require perfect symmetry, but the lows must be at approximately the same price level.
Pattern Symmetry
For a pattern to qualify as a Tweezer Bottom, the lows must be at approximately the same price level. The greater the symmetry, the stronger the potential for a reversal. If the lows are significantly different, the pattern may be seen as a two-touch support formation or a pattern with two equal lows.
The symmetry level is an important factor in determining the strength of the formation. When the lows are nearly identical, it indicates that the market has tested the support level twice and failed to break it, suggesting that the support is strong and the market may soon reverse direction.
Support and Resistance
The Tweezer Bottom Pattern is closely linked to support levels. It forms when the price tests a support level and fails to break lower. This failure to break suggests a potential shift in sentiment, as buyers begin to push the price higher. The key to identifying this formation is recognizing when it occurs at a significant support level that has been tested multiple times.
When the formation appears at a strong support zone, it adds credibility to the reversal signal. Support levels that have held firm in the past are more likely to hold again, making this pattern a reliable signal that the market is preparing for an upward move.

4. How to Identify the Tweezer Bottom on Charts
Visual Clues and Chart Analysis
To identify the Tweezer Bottom, traders should look for the following visual clues:
- Two candlesticks with similar lows.
- Long lower shadows indicating rejection of lower prices.
- Small bodies suggesting indecision in the market.
- The formation occurring at a strong support level.
Traders should also pay attention to the volume during the formation of the pattern. Higher volume during the second candlestick can provide additional confirmation that the market is testing the support level with increasing interest.
Key Candlestick Characteristics
When identifying this pattern, traders should look for candlesticks with long lower shadows and small bodies. The long shadows are essential because they indicate that the price attempted to move lower but was rejected. The small bodies suggest market indecision, which is typical of reversal patterns.
Additionally, the close-to-close similarity between the two candlesticks is important. The two candles should have very similar closing prices, further confirming the potential for a reversal.
5. Why the Tweezer Bottom is a Bullish Reversal Signal
Market Psychology Behind the Pattern
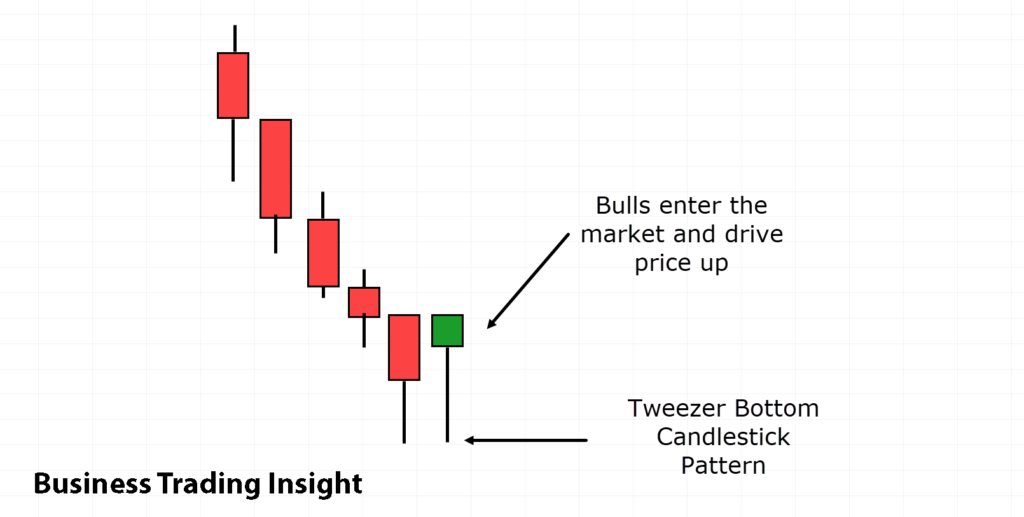
The Tweezer Bottom is not just a technical formation; it also provides valuable insights into market psychology. When this pattern forms, it reflects a battle between buyers and sellers at a critical price level. Sellers have pushed the price down during the preceding downtrend, but as the price tests the support level for a second time, buyers begin to step in, creating a shift in sentiment.
This candlestick formation signals that the market has tested the support area twice without being able to break below it. This failure to break lower indicates that sellers are losing their grip, and buyers are starting to dominate. The shift in control is what makes this formation such a reliable bullish reversal signal — it reflects the point at which the trend is likely to change direction.
Understanding the psychology behind this setup helps traders anticipate price movements. When the market tests a support level twice and fails to break it, buyers gain confidence, often leading to a surge in buying activity. This surge frequently pushes the price higher, marking the beginning of a new bullish trend.
How Buyers and Sellers Interact
The formation of this pattern illustrates a key moment in the tug-of-war between buyers and sellers. During the formation of the pattern, sellers push the price lower, but buyers consistently step in at the same support level to prevent further declines. This battle is reflected in the candlesticks: the long lower shadows of the two candles suggest that the price moved lower but was rejected at a certain point, indicating the intervention of buyers.
As the second candle forms with a similar low to the first one, it suggests that the support level is being tested again. When the price fails to break below this level, it signals that the sellers have exhausted their efforts, and buyers are starting to take control. This shift in sentiment is one of the primary reasons why this formation is considered a bullish reversal signal.
The price action associated with this formation typically suggests that the market is ready to transition from a bearish trend to a bullish one. As buyers gain strength, the price may move higher, signaling the beginning of a new uptrend.
Signaling Price Reversal
The Tweezer Bottom Pattern serves as a clear signal of a potential price reversal. When the price hits a support level twice and fails to break below it, traders interpret this as a sign that the bearish trend has run its course. The market has tested the support and found it to be strong enough to hold the price, which is typically followed by an upward price movement.
This reversal is not instantaneous, but the pattern provides traders with a clear signal that the trend may be changing. Traders often wait for confirmation of the reversal, such as a break above the high of the second candlestick, before entering a long position.
Volume and Confirmation
For this formation to be a reliable bullish reversal signal, confirmation through volume is essential. Volume plays a critical role in validating the pattern. If the price breaks above the high of the second candlestick and this breakout is accompanied by an increase in volume, it provides strong confirmation that the reversal is genuine.
Rising volume during the breakout suggests that there is increased buying interest, which can lead to further price appreciation. Without volume confirmation, the pattern may be less reliable, and traders should exercise caution before entering a trade.
Volume also helps traders avoid false signals. If the price breaks above the second candlestick’s high, but volume does not increase, it may indicate that the breakout is not supported by strong buying interest, which could signal that the reversal is weak or may fail.
6. Confirmation with Other Indicators
Volume Analysis
As mentioned earlier, volume is a key factor in confirming the validity of this candlestick pattern. A significant increase in volume during the breakout above the high of the second candlestick reinforces the idea that buyers are stepping in to support the price and that the market is likely to reverse its bearish trend.
Traders should look for volume spikes during the second candlestick or the breakout above the high of the second candle. This signals that the bullish reversal is gaining momentum and that the market may be ready for a move higher. Conversely, low volume during the breakout suggests that the move may lack strength and could result in a false signal.
RSI and Stochastic Indicators
The Relative Strength Index (RSI) and Stochastic Oscillator are two of the most commonly used momentum indicators that can provide additional confirmation for the Tweezer Bottom.
When the pattern forms in an oversold market, as indicated by an RSI reading below 30 or a Stochastic Oscillator below 20, it increases the reliability of the reversal. Oversold conditions suggest that the market has been oversold and is due for a rebound. When combined with the pattern, this condition adds to the confirmation that the bearish trend is likely to end, and a bullish reversal is imminent.
MACD Divergence
The Moving Average Convergence Divergence (MACD) is another valuable tool for confirming the validity of the Tweezer Bottom. MACD divergence occurs when the price forms new lows while the MACD does not confirm the new low, indicating that the selling momentum is weakening.
When the pattern forms at the same time as a bullish MACD divergence, this is a powerful confirmation that the downtrend is losing momentum and a reversal may be imminent. Divergence between the MACD and the price can often lead to significant trend changes, making it a useful tool for traders seeking confirmation of the reversal signaled by this formation.
Trendlines and Moving Averages
Trendlines and moving averages can also be used to validate this candlestick pattern. If the formation occurs near a significant trendline or a key moving average (such as the 50-period or 200-period moving average), this adds further confirmation that the support level is solid and the market may reverse.
For example, if the price is testing a long-term upward trendline or bouncing off a moving average, the Tweezer Bottom at that level is likely to be more significant. Traders often use these tools in combination to increase the reliability of the reversal signal provided by this pattern.
Support and Resistance Zones
Combining the pattern with horizontal support levels or key Fibonacci retracement levels can further enhance the validity of the formation. If the Tweezer Bottom Pattern occurs at a major support zone or a key Fibonacci level (such as the 61.8% retracement), it increases the likelihood of a strong bullish reversal.
Support and resistance zones act as psychological barriers for traders, and when a reversal pattern like this one forms at one of these levels, it suggests that the price has encountered a significant level of demand, which may result in a price reversal.
7. Trading Strategies Based on the Tweezer Bottom
Entry Points
Once the Tweezer Bottom has been identified and confirmed, traders can look for an entry point. The most common strategy is to wait for the price to break above the high of the second candlestick in the pattern. This breakout confirms that the market has shifted from a bearish to a bullish trend, and entering a trade at this point allows traders to capitalize on the potential for price growth.
Some traders may choose to enter the position earlier, as soon as the reversal pattern is formed, especially if it occurs at a strong support level and is supported by other indicators like volume, RSI, or MACD divergence. However, waiting for confirmation via a break above the second candlestick’s high can help reduce the risk of false breakouts.
Setting Stop-Loss Orders
Risk management is a critical aspect of any trading strategy, and placing stop-loss orders when trading this pattern is essential. A common approach is to place the stop-loss just below the lows of the Tweezer Bottom. This provides protection in case the price breaks below the support level and the pattern fails.
If the price drops below the support, it suggests that the expected bullish reversal may not materialize, and the trader should exit the position to minimize losses. Setting a stop-loss just below the lows of the pattern helps ensure that the risk is contained if the market moves against the trader.
Take-Profit Levels
Take-profit levels can be set based on the size of the previous downtrend or key resistance areas. A typical approach is to set a profit target equal to the height of the downtrend leading into the formation. This allows traders to capture a reasonable portion of the expected price movement while managing risk appropriately.
Traders should also consider using trailing stop orders to lock in profits as the price moves higher. A trailing stop allows traders to capture more profits if the price continues to rise while protecting against sudden reversals.
Risk-to-Reward Ratio
When trading this candlestick formation, it is essential to calculate the risk-to-reward ratio to ensure that the potential reward justifies the risk taken. A favorable risk-to-reward ratio increases the likelihood of successful trades over time and helps traders avoid taking excessive risks on any single trade. A typical risk-to-reward ratio for this pattern might range from 1:2 to 1:3, depending on the trader’s risk tolerance and the expected price movement.
8. Challenges and Pitfalls of the Tweezer Bottom Pattern
False Signals and Market Noise
Like any technical setup, the Tweezer Bottom Pattern is not foolproof. False signals can occur when market conditions are volatile or when the pattern forms in a weak or unclear trend. Traders should be cautious when the market is highly unpredictable, as this reversal setup may not always lead to a reliable outcome.
To avoid false signals, traders should use additional confirming indicators such as volume, RSI, MACD divergence, or Fibonacci levels. These tools can help verify that the formation is a valid signal and not just a temporary market fluctuation.
Pattern Failure
Despite its reliability, this candlestick setup can fail to indicate a reversal if the market does not respond as expected. A failed Tweezer Bottom is characterized by the price breaking below the lows of the pattern and continuing in the original downtrend. This can be frustrating for traders who have entered a position based on the pattern.
To manage this risk, traders should use stop-loss orders and consider adjusting their strategy if the price breaks below the support level. The pattern is a signal, not a guarantee, and traders should be prepared for the possibility that it may not play out as anticipated.
Common Mistakes
One of the most common mistakes traders make when using the Tweezer Bottom is misinterpreting the pattern. Not every candlestick formation with two similar lows qualifies as a valid reversal signal. Traders should ensure that the lows are approximately at the same level and that the pattern occurs at a significant support level.
Another mistake is overrelying on this formation as a standalone signal. While it can be a strong indicator of a potential reversal, it should be used in conjunction with other technical analysis tools to increase the likelihood of a successful trade.
9. Comparing the Tweezer Bottom to Other Reversal Patterns
Double Bottom vs. Tweezer Bottom
The Tweezer Bottom Pattern and the Double Bottom are both popular bullish reversal patterns, but there are key differences between them. Both patterns involve two lows at or near the same level, but the way they form and the significance of the price action differ.
A Double Bottom typically takes more time to form, occurring over a longer period. The first low is followed by a retracement or rally, and then the price drops again to test the same support level before reversing upwards. The Double Bottom formation is often larger and more noticeable on longer timeframes, such as weekly or monthly charts. It signals a more gradual shift in market sentiment, with the second test of the support level acting as confirmation that the downtrend has been exhausted.
In contrast, the Tweezer Bottom forms more quickly, typically over just two candlesticks. It signals a rapid rejection of lower prices at a support level and suggests that buyers are stepping in quickly after the market tests the support twice. While the Double Bottom is often seen as more reliable due to its longer formation, the Tweezer Bottom can provide a faster and more aggressive signal for traders looking for quicker reversals.
One advantage of the Tweezer Bottom Pattern is that it can be used on shorter timeframes, such as 4-hour or daily charts, making it ideal for day traders or swing traders. The Double Bottom, in contrast, is often more suitable for longer-term traders due to its slower development.
Hammer and Inverted Hammer
The Tweezer Bottom is often compared to the Hammer and Inverted Hammer candlestick patterns, as they all involve a rejection of lower prices and indicate a potential reversal. However, there are distinct differences in their structure and meaning.
A Hammer occurs after a downtrend and features a small body near the top of the candlestick with a long lower shadow. This suggests that the market has tried to move lower, but buyers have stepped in to push the price back up, signaling a potential reversal. An Inverted Hammer is similar but occurs after an uptrend and features a long upper shadow with a small body at the bottom, indicating that the price tried to rally but faced rejection.
Unlike the Tweezer Bottom, which requires two candlesticks with similar lows, both the Hammer and Inverted Hammer are single candlestick patterns. The Tweezer Bottom is often seen as a more reliable reversal signal because it represents a two-touch support level, confirming that buyers are consistently willing to defend the support.
While the Hammer and Inverted Hammer can also serve as reversal indicators, they lack the double confirmation that the Tweezer Bottom Pattern provides. The latter represents a more solid confirmation of market rejection at a support level, whereas a single candlestick pattern might not carry the same level of conviction.
Head and Shoulders Pattern
The Head and Shoulders pattern is one of the most well-known reversal formations, and it contrasts with the Tweezer Bottom in both structure and timing. The Head and Shoulders is typically a larger, more complex pattern that signals a reversal from an uptrend to a downtrend. It involves three peaks: a higher peak (the head) between two lower peaks (the shoulders). The pattern is completed when the price breaks below the «neckline,» confirming the reversal.
While the Head and Shoulders pattern signals a trend reversal, it is generally used to identify bearish reversals after an uptrend, whereas the Tweezer Bottom Pattern signals a bullish reversal after a downtrend. The Head and Shoulders pattern can take much longer to form, often spanning several weeks or months, and is typically more suitable for long-term traders who can wait for the full pattern to develop.
In contrast, the Tweezer Bottom Pattern is quicker and simpler, forming in a matter of hours or days. It is particularly useful for traders looking for short-term reversal signals, especially when the market is approaching a significant support level.
One key difference is that the Head and Shoulders pattern often has more reliable predictive power due to its larger and more well-defined structure, while the Tweezer Bottom can sometimes produce false signals, especially if it occurs in a weak trend or without confirmation from other indicators.
10. Advanced Topics and Insights
Using the Tweezer Bottom with Fibonacci Levels
Fibonacci retracement levels are a powerful tool for traders, and when combined with the Tweezer Bottom pattern, they can provide even more reliable reversal signals. The Fibonacci retracement tool is based on the idea that markets move in predictable cycles, and key retracement levels (such as 38.2%, 50%, and 61.8%) can serve as support and resistance levels.
When a Tweezer Bottom forms near one of these Fibonacci levels, it suggests that the market is respecting a significant price point, making the reversal more likely. For instance, if the price forms this pattern at the 61.8% retracement level, it could indicate that the downtrend has reached a critical support level, and a reversal is probable.
Traders often look for confluence between the pattern and other technical indicators, like Fibonacci retracements or extensions. When multiple factors align, the signal becomes stronger, and the probability of a successful trade increases.
Seasonality and the Tweezer Bottom
Seasonality plays a crucial role in the reliability of this pattern. Some markets exhibit seasonal tendencies, where price movements follow specific patterns at certain times of the year. For example, commodities like oil and gold often fluctuate based on seasonal factors like supply disruptions, harvest cycles, or geopolitical events.
When the pattern forms during a period of historically bullish seasonality, the probability of a successful reversal increases. Understanding market seasonality helps traders anticipate when a Tweezer Bottom is more likely to result in a significant price change.
For example, if a stock tends to rise in the second quarter, a formation in the first quarter could signal a strong impending rally. By combining seasonal analysis with technical patterns, traders refine their strategies and improve their chances of identifying profitable opportunities.
The Psychology Behind the Tweezer Bottom
The Tweezer Bottom reflects collective market psychology. The pattern forms when the market attempts to push prices lower but is rejected at a specific level, signaling a shift in sentiment. This shift occurs when sellers lose momentum and buyers begin to assert control.
Understanding the psychology behind the formation is key for traders. When price tests a strong support level and fails to break lower, it fosters confidence among buyers, leading to a buying spree that drives the bullish reversal. Traders who recognize these psychological dynamics can leverage them by entering long positions at the right time.
Algorithmic and Quantitative Analysis
In modern trading, algorithmic and quantitative strategies are gaining popularity. These systems use advanced algorithms to identify and trade patterns like the Tweezer Bottom. Algorithms can scan vast amounts of data to detect formations and execute trades automatically based on predefined criteria.
Traders using algorithmic systems benefit from high-frequency data analysis and fast execution, allowing them to identify patterns more quickly than manual traders. While algorithmic trading offers many advantages, it’s important to understand how these systems work and implement sound risk management practices.
By combining this pattern with quantitative analysis, traders can develop automated strategies that capitalize on the pattern’s predictive power without constant market monitoring.
Real-World Case Studies and Historical Examples
Successful Tweezer Bottom Reversals
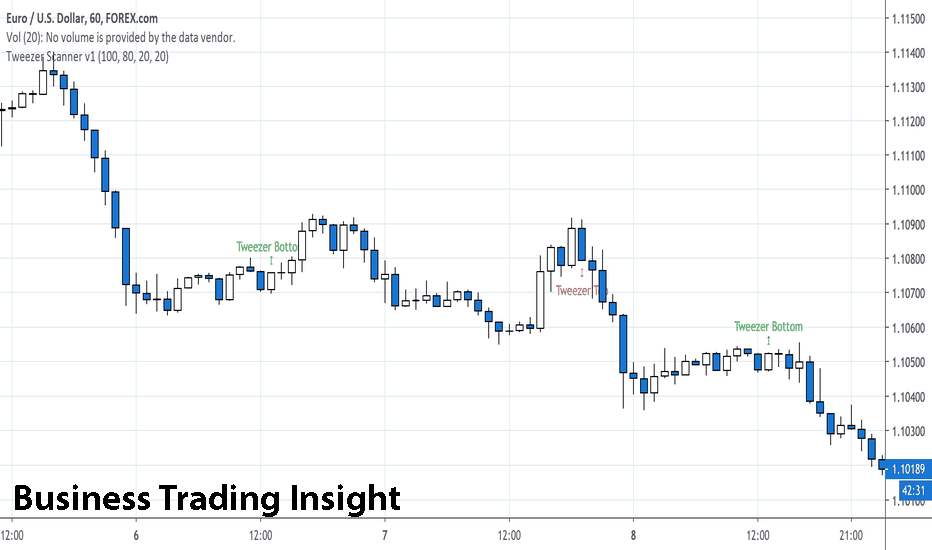
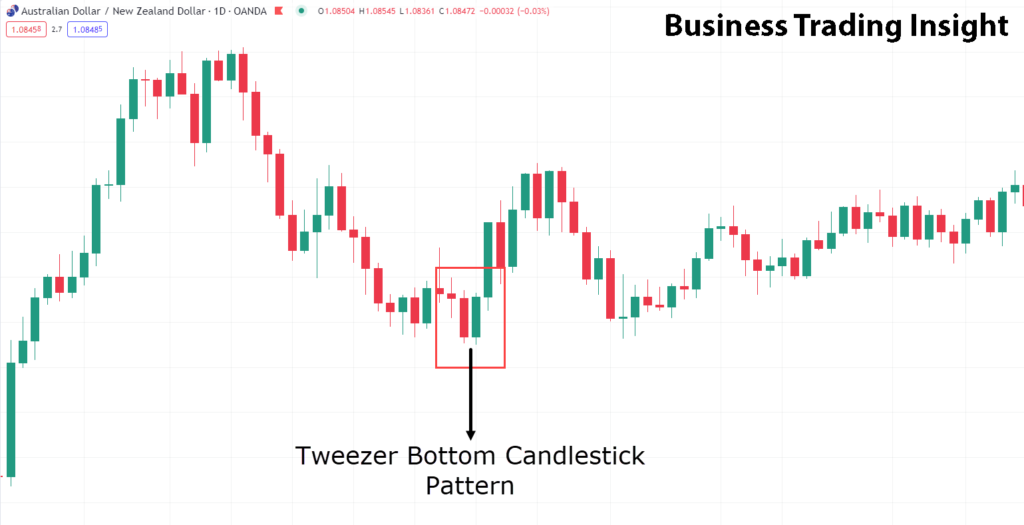
The pattern has been successfully identified in numerous historical price charts, providing profitable opportunities. For example, in the forex market, the Tweezer Bottom often forms at critical support levels, such as around the 1.2000 mark in the EUR/USD pair. When the price fails to break this level twice and forms the pattern, it indicates that a bullish reversal is likely, often leading to significant upward movement.
Another example can be found in the stock market. Companies like Apple (AAPL) and Tesla (TSLA) have experienced these formations during periods of market correction. When the pattern appeared near key support levels, it marked the end of downtrends and led to subsequent price rallies. Analyzing historical chart examples helps traders understand how the pattern behaves across different markets and asset classes.
Failed Tweezer Bottoms
While the pattern is a powerful reversal signal, it is not foolproof. In times of extreme market volatility or weak trends, the pattern may form but fail to trigger a reversal. A common failure scenario occurs when the price breaks below the lows of the pattern, signaling that the downtrend remains intact.
Traders can minimize the risk of false signals by waiting for confirmation from other indicators, such as volume, RSI, or MACD divergence. Additionally, placing stop-loss orders just below the pattern’s lows helps protect against potential losses if the reversal does not materialize.
Conclusion
Summary of Key Points
The Tweezer Bottom is a reliable bullish reversal pattern that traders can use to spot potential trend changes. It forms when the price tests a support level twice and fails to break lower, signaling that buyers are stepping in to defend the price point. The pattern is most effective when confirmed by other indicators, like volume, RSI, and Fibonacci levels.
Final Trading Advice
When trading the Tweezer Bottom Pattern, it’s essential to apply proper risk management strategies, such as placing stop-loss orders and calculating favorable risk-to-reward ratios. Additionally, confirming the pattern with other technical indicators helps ensure the signal’s validity and reduces the risk of false breakouts.
The Importance of Continuous Learning
It’s crucial for traders to continue learning and refining their strategies. The Tweezer Bottom is just one of many technical patterns available. By practicing with real-world case studies, observing market conditions, and using multiple indicators for confirmation, traders can improve their ability to identify profitable opportunities and enhance their trading approaches.


