The Triple Bottom Pattern is one of the most reliable technical analysis tools for traders seeking to identify trend reversals in the market. Whether you’re a beginner or an experienced trader, understanding this chart pattern is crucial for recognizing potential buying opportunities. In this article, we will dive deep into the details of the Triple Bottom, explaining its structure, how to recognize it on charts, and how to use it to inform your trading decisions. Additionally, we’ll explore the psychology behind the pattern, the risks involved, and the strategies for maximizing your trading success.
Introduction to the Triple Bottom Pattern
The Triple Bottom Pattern is a bullish reversal pattern that traders often use to predict the end of a downtrend and the beginning of an uptrend. Formed by three lows that occur at approximately the same price level, this pattern signals that the market is ready to shift from bearish sentiment to bullish momentum. It is considered one of the most reliable patterns in technical analysis because it indicates a strong shift in market psychology.
Importance and Significance of the Triple Bottom Pattern
The importance of the Triple Bottom Pattern cannot be overstated. It is one of the key formations that traders rely on to identify trend reversals, especially in volatile markets. When a Pattern with three lows appears, it provides traders with clear signals of potential buying opportunities, as the market has tested a specific price level multiple times and has failed to breach it. This indicates that demand is starting to outpace supply, and a shift to an uptrend is likely.
The Triple Bottom Pattern is especially valuable because it is relatively easy to spot on charts and can be used in both short-term and long-term trading strategies. By recognizing this pattern early, traders can position themselves to take advantage of substantial price movements.
Purpose of the Article
The purpose of this article is to provide a comprehensive understanding of the Triple Bottom Pattern, including its structure, recognition, and application in real-world trading scenarios. We will also cover the risks associated with trading this pattern and offer actionable strategies for maximizing profitability.
What is the Triple Bottom Pattern?
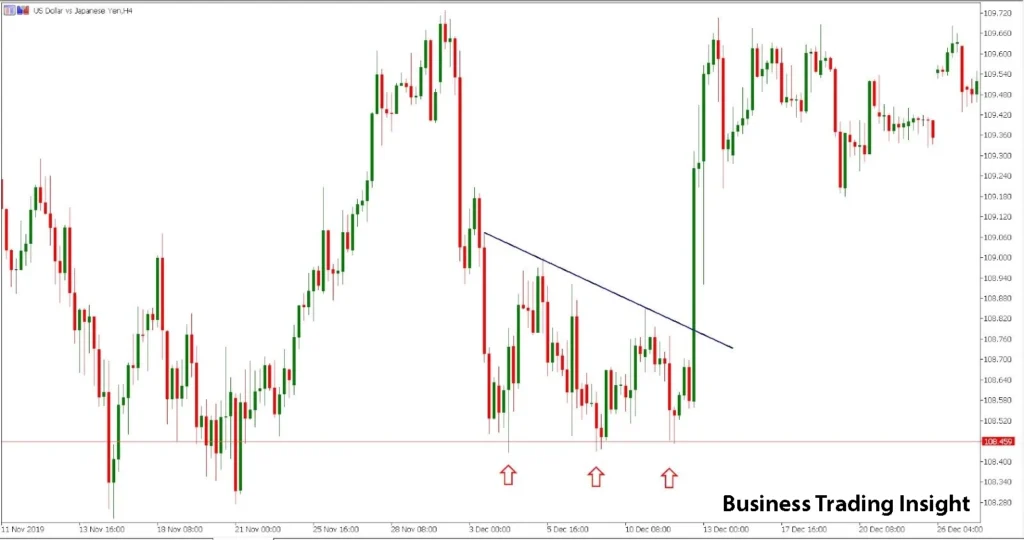
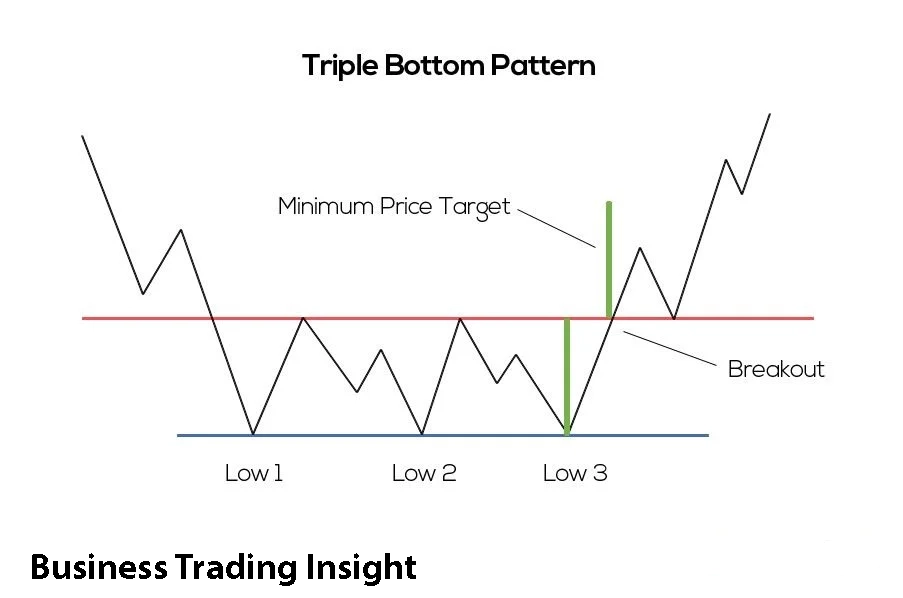
The Triple Bottom Pattern is a chart pattern that consists of three consecutive lows, each occurring around the same price level, with brief periods of consolidation between them. These three lows form a «W» or «U» shape on the chart, and this formation typically signals a reversal from a downtrend to an uptrend.
In simpler terms, the Triple Bottom Pattern is a Formation with three reversal points. It shows that buyers are gradually entering the market, and the downtrend is weakening. After the third low, if the price breaks through the resistance level, the pattern is confirmed, and the market may experience a strong upward movement.
Psychology Behind the Pattern
The psychology behind the Triple Bottom Pattern is rooted in the market dynamics of supply and demand. Initially, as the price moves downward, it reflects the dominance of the bears (sellers) in the market. The first two lows in the pattern reflect the sellers’ continued push, but with each successive low, the downward pressure weakens.
- Phase 1: The first low is formed as selling pressure forces the price down. Once the price reaches this level, traders may begin to take profits, leading to a brief period of consolidation.
- Phase 2: The second low is created when the price again drops to the same level, but with less force. This suggests that the bears are losing their strength, and the market is beginning to stabilize.
- Phase 3: The third low forms at nearly the same price level as the previous two. This is often where the bulls begin to take control, and demand starts to outweigh supply. If the price breaks the resistance level that connects the tops of the three lows, the trend reversal is confirmed.
Structure of the Triple Bottom
Understanding the structure of the Triple Bottom Pattern is key to identifying it on a chart and using it effectively for trading. The pattern is made up of several key phases that unfold in a predictable way.
Phases of the Triple Bottom Formation
1. First Bottom (Phase 1)
The first leg of the Triple Bottom Pattern begins with a significant price drop, which forms the first low. This phase typically indicates that the bears (sellers) are in control of the market. After reaching this low, the price often consolidates for a period, which sets the stage for the second bottom.
At this point, traders may notice some early signs of stabilization, as selling pressure starts to diminish.
2. Second Bottom (Phase 2)
The second leg of the pattern involves another price drop, but this time the low should be at nearly the same level as the first low. The price will often bounce slightly after this drop, confirming that the market is finding support at this level. During this phase, volume typically decreases, indicating that the bears are losing their strength.
The second bottom is crucial because it signals that the downtrend is weakening, and the market may soon be ready to reverse.
3. Third Bottom (Phase 3)
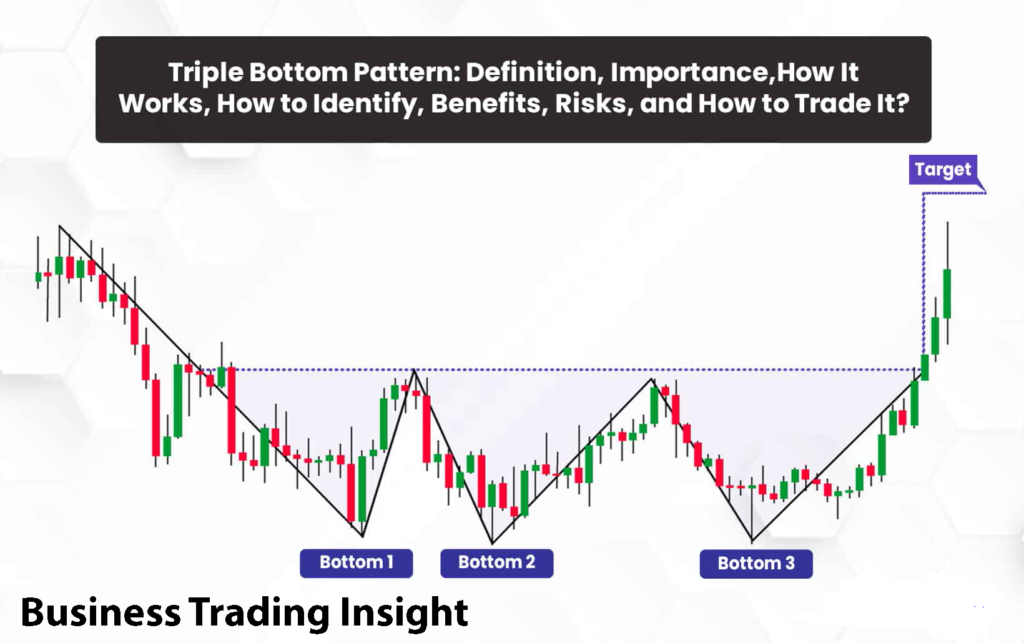
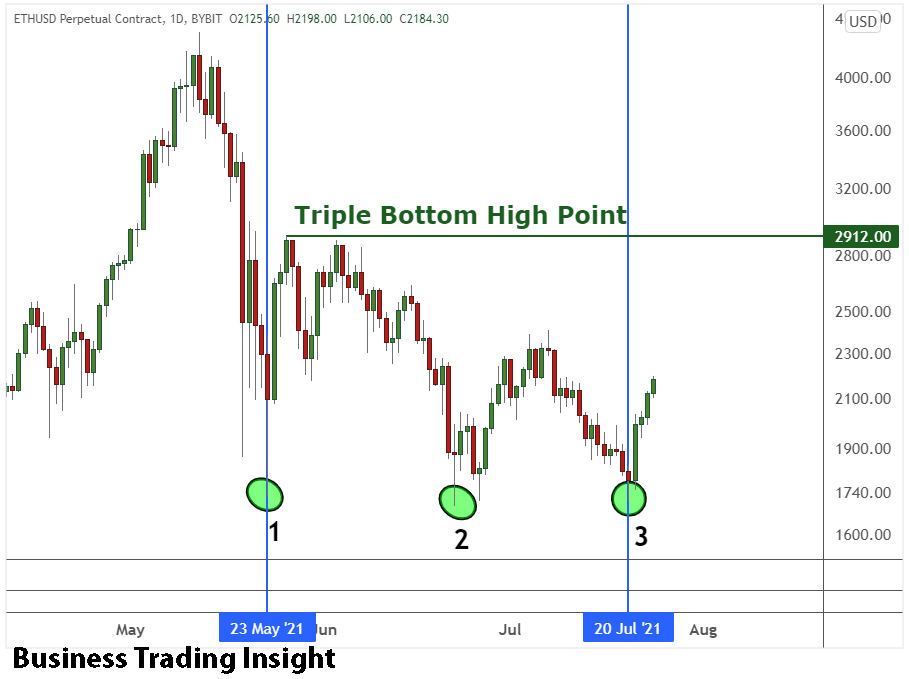
The third bottom forms at approximately the same price level as the first two. This is the most critical part of the Triple Bottom Pattern, as it confirms that the market has tested this level three times without being able to break through. Traders often look for signs of exhaustion in the selling pressure and a shift in momentum.
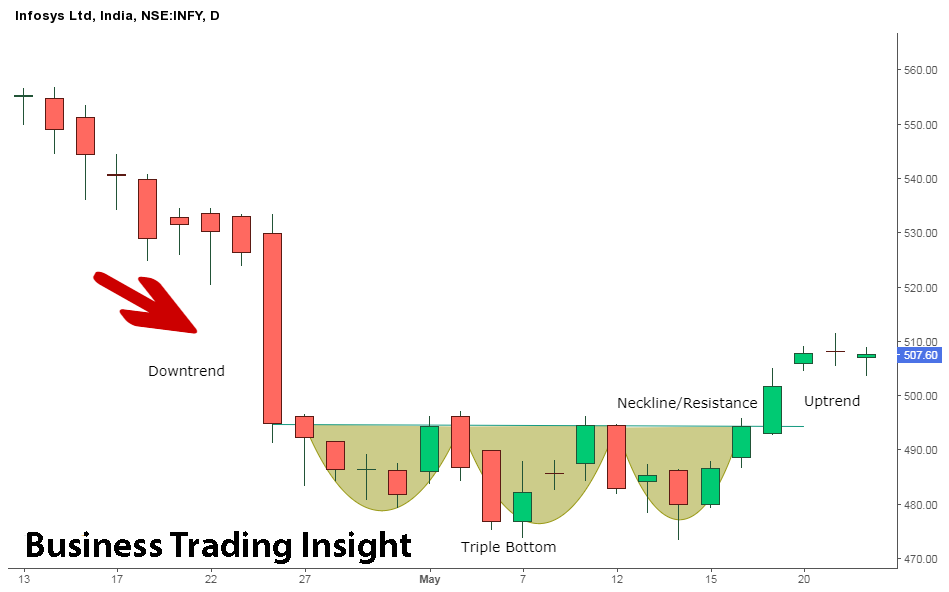
Following the third bottom, a breakout above the resistance level—known as the neckline—indicates that the pattern is complete and that the market is ready to begin its upward movement.
The Neckline
The neckline is the resistance level that connects the peaks between the bottoms. This level serves as a benchmark for confirming the Triple Bottom Pattern. A breakout above the neckline signals the end of the bearish trend and the beginning of the bullish trend.
How to Recognize the Triple Bottom on the Chart
Recognizing the Triple Bottom Pattern on a chart requires understanding its key characteristics and structure. Traders should look for the following:
Key Characteristics of the Triple Bottom
- Three Distinct Lows: The pattern consists of three lows, each forming around the same price level. These lows should appear as a series of three consecutive lows or three-touch support levels.
- “U”-Shaped Structure: The formation resembles a «U» or «W» shape, with the three lows creating the base of the «U» and the neckline representing the top of the «W».
- Volume Dynamics: Volume plays a crucial role in confirming the pattern. Each of the bottoms should occur with relatively low volume, but a noticeable increase in volume should occur once the price breaks through the neckline.
- Neckline Breakout: After the third low, the price must break above the neckline to confirm that the Triple Bottom Pattern is complete and the trend reversal has occurred.
Important Details to Consider
- Duration of the Pattern: The Triple Bottom Pattern typically takes weeks or months to form. The longer it takes to complete, the more reliable the breakout is likely to be.
- Quality of the Pattern: The quality of the pattern is directly related to how accurately the three lows are aligned and the overall market conditions during the formation of the pattern. A symmetrical formation with three lows at nearly identical price levels is a strong indication of a trend reversal.
Technical Analysis and Confirmation of the Triple Bottom Pattern
Using additional technical indicators can help confirm the validity of the Triple Bottom Pattern and increase the likelihood of a successful trade. Here are some tools that can be combined with the pattern for more reliable results.
Using Additional Indicators
- RSI (Relative Strength Index): The RSI is a momentum oscillator that can help confirm the strength of the trend reversal. If the RSI is in the oversold territory (below 30) at each of the bottoms, it suggests that the market is ready for a reversal.
- MACD (Moving Average Convergence Divergence): The MACD is another useful tool for confirming trend changes. When the MACD crosses above its signal line after the breakout, it provides further confirmation of the uptrend.
- Volume: Volume is one of the most important indicators for confirming the Triple Bottom Pattern. On each of the bottoms, volume should be relatively low. However, when the price breaks above the neckline, there should be a noticeable increase in volume, indicating that the buying interest is rising.
Other Confirmation Strategies
- Fibonacci Retracements: Applying Fibonacci retracements to the breakout level can help identify potential price targets after the pattern completes.
- Moving Averages: Using moving averages like the 50-day and 200-day exponential moving averages (EMA) can provide additional buy signals when a short-term moving average crosses above a longer-term one.
Target Levels and Profit Calculation
After the Triple Bottom Pattern completes, traders often want to set price targets to maximize profits. Here’s how to calculate your potential target:
How to Determine Price Targets
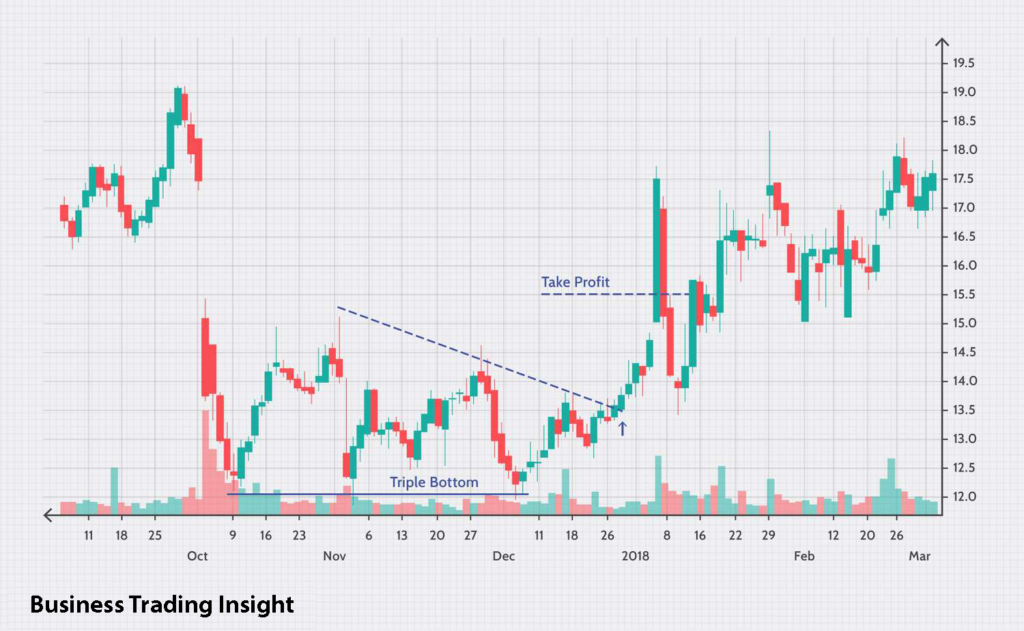
To calculate the price target after the breakout, measure the distance from the neckline to the lowest point of the pattern (typically the first or third low). Then, project this distance upward from the breakout point. For example, if the neckline is at $100 and the lowest point is at $80, the target would be $120 ($100 + ($100 — $80)).
Setting Stop-Losses and Profit Targets
- Stop-Loss: A stop-loss should be set just below the lowest point of the pattern to protect against false breakouts.
- Profit Targets: Traders can take profits when the price reaches the target level, or use a trailing stop to lock in gains as the price continues to move upward.
Factors Affecting the Success of the Triple Bottom Pattern
While the Triple Bottom Pattern can be a powerful indicator for trend reversals, its success can be influenced by a number of external factors. Understanding these variables can help traders assess the reliability of the pattern and improve their trading decisions.
Market Conditions and Volatility
The success of the Triple Bottom Pattern can be significantly impacted by the market environment. In volatile markets, the pattern may form more quickly, and the signals can become less reliable. Rapid price fluctuations can cause false breakouts, which can lead to losses for traders who act too early. In such markets, it is crucial to use additional indicators and risk management techniques to filter out false signals.
For example, if the market is experiencing high volatility due to global economic events, the pattern might form in a shorter time frame. This could increase the risk of a failed breakout, as sharp price movements can sometimes lead to false signals. In contrast, in a stable market with lower volatility, the Triple Bottom Pattern may take longer to form, but the breakout is often stronger and more reliable.
Fundamental Factors
While technical analysis tools like the Triple Bottom Pattern are essential for identifying potential trend reversals, fundamental factors also play an important role in shaping the market’s direction. News, economic reports, corporate earnings announcements, geopolitical events, or changes in interest rates can all have a major impact on price action.
For instance, an unexpectedly positive economic report or a central bank decision to cut interest rates might trigger a stronger reversal after the Triple Bottom Pattern completes, confirming the trend reversal. Conversely, negative news or unforeseen geopolitical events can undermine the breakout, causing the price to reverse again.
Correlation with Other Instruments
Another factor that can affect the reliability of the Triple Bottom Pattern is the correlation with other assets or markets. If the asset you’re trading is closely correlated with other assets, such as commodities or currency pairs, it may be beneficial to look at those assets for additional confirmation of the trend reversal.
For example, if you’re trading a stock and notice a Triple Bottom Pattern, it might be wise to check the broader market index (such as the S&P 500) or the sector the stock belongs to. If these indices are showing signs of a bullish trend or also exhibiting similar chart patterns, it can confirm that the market is likely to follow through on the reversal indicated by the Triple Bottom Pattern.
Risks and How to Avoid False Signals
While the Triple Bottom Pattern can be a very reliable signal for a trend reversal, it is not foolproof. Like all chart patterns, it comes with risks, especially the possibility of false breakouts.
How to Avoid False Breakouts
False breakouts occur when the price breaks through the neckline but then quickly reverses and falls back below it. To avoid being trapped in a false breakout, consider the following strategies:
- Wait for Confirmation: Don’t enter a trade as soon as the price breaks the neckline. Wait for confirmation that the breakout is legitimate. Look for a close above the neckline with increased volume and momentum.
- Use Additional Indicators: Confirm the breakout using other technical indicators, such as RSI, MACD, or volume analysis. For instance, a RSI above 30 (moving out of the oversold region) can be an additional signal that the trend is reversing.
- Consider the Overall Market Trend: A Triple Bottom Pattern is more reliable when it forms after a prolonged downtrend. If the market has been sideways or range-bound, the pattern might not be as effective.
- Trade on Higher Timeframes: Shorter timeframes often produce more noise and can result in more false breakouts. Therefore, trading on higher timeframes (such as the daily or weekly chart) can reduce the likelihood of being caught in a false breakout.
- Set a Tight Stop-Loss: A stop-loss should always be used to protect your position in case the breakout is false. Setting a stop just below the lowest point of the pattern provides an exit strategy if the price starts moving in the opposite direction.
Example of a False Breakout
Imagine that you identify a Triple Bottom Pattern on a stock chart. The price breaks above the neckline, and you enter a long position. However, the price immediately drops below the neckline again, trapping you in a losing position. This is a classic example of a false breakout. To avoid this, you should have waited for confirmation with higher volume or additional indicators like RSI and MACD before entering the trade.
Conclusion: Using the Triple Bottom Pattern for Effective Trading
In conclusion, the Triple Bottom Pattern is a powerful and reliable chart pattern for identifying trend reversals. By recognizing this formation and understanding the underlying psychology, traders can take advantage of bullish opportunities and maximize their profit potential. However, like all chart patterns, it is essential to combine the Triple Bottom with additional indicators and sound risk management practices to ensure a higher probability of success.
Key Takeaways:
- The Triple Bottom Pattern signals a trend reversal from bearish to bullish, formed by three lows at similar price levels.
- The pattern’s success is influenced by market conditions, volume dynamics, and the use of additional technical indicators for confirmation.
- Although the Triple Bottom Pattern is a reliable tool, traders must be cautious of false breakouts and use proper risk management techniques.
- It is essential to practice identifying and trading the pattern in a demo account before applying it to live trades.
By consistently practicing the identification of the Triple Bottom Pattern, combining it with other analysis tools, and applying a disciplined approach to trading, traders can enhance their ability to profit from market reversals and minimize the risks associated with trend changes.
Remember, while the Triple Bottom Pattern is a powerful tool, it is just one part of a broader trading strategy. Always consider market fundamentals, other technical indicators, and sound risk management when using this pattern to guide your trades.
FAQ
What is the significance of the neckline in the Triple Bottom Pattern?
The neckline is a key resistance level that connects the peaks between the three lows. It represents the point at which selling pressure is overcome and buying momentum begins to build. A breakout above the neckline indicates that the market has shifted from bearish to bullish, confirming the reversal and often signaling the start of an uptrend. The neckline is crucial for traders to identify the pattern's completion and potential buy signal.
What is the psychology behind the Triple Bottom Pattern?
The Triple Bottom Pattern reflects the changing dynamics of supply and demand. Initially, the bears (sellers) dominate, pushing the price lower. As the price reaches a certain level three times and fails to drop further, buying pressure begins to outweigh selling pressure. The market starts to stabilize and consolidate, and by the third low, buyers begin to step in more aggressively, leading to a shift in sentiment from bearish to bullish. This pattern suggests that the market has tested its limits and is now likely to reverse direction.
How can I confirm the validity of a Triple Bottom Pattern?
Confirmation of the Triple Bottom Pattern can be achieved through several technical indicators. Look for an increase in volume when the price breaks above the neckline, as this signals growing buying interest. Additionally, momentum indicators like RSI (Relative Strength Index) can be useful; if the RSI moves out of the oversold territory (below 30) at each bottom, it suggests the reversal is gaining strength. MACD (Moving Average Convergence Divergence) can also confirm the trend reversal if it crosses above the signal line after the breakout. These indicators help to validate the pattern and reduce the likelihood of false breakouts.
What are the risks of trading the Triple Bottom Pattern?
One of the primary risks when trading the Triple Bottom Pattern is the potential for false breakouts. A false breakout occurs when the price temporarily moves above the neckline but quickly reverses and falls back below it, trapping traders who enter the market prematurely. To mitigate this risk, it's important to wait for confirmation, such as a close above the neckline with strong volume and momentum. Additionally, it's crucial to use proper risk management strategies, such as setting a stop-loss just below the lowest point of the pattern to protect against unexpected reversals. False breakouts can also be more common in volatile markets, so considering market conditions is key.
