Pullback trading is one of the most commonly used strategies in the world of financial markets. The strategy is based on the idea that trends in the market do not move in a straight line but tend to experience short-term reversals, or «pullbacks,» before continuing their overall direction. For traders, identifying these pullbacks offers opportunities to enter a trade at a favorable price, enhancing the chances of capturing a larger move in the prevailing trend.
This guide aims to provide an in-depth understanding of pullback trading, from its fundamentals to advanced strategies, as well as common pitfalls and risk management techniques. Whether you’re a beginner or an experienced trader, understanding pullback trading can enhance your decision-making process and improve your profitability in the market.
What is Pullback Trading?
What is a Pullback in the Context of Trading?
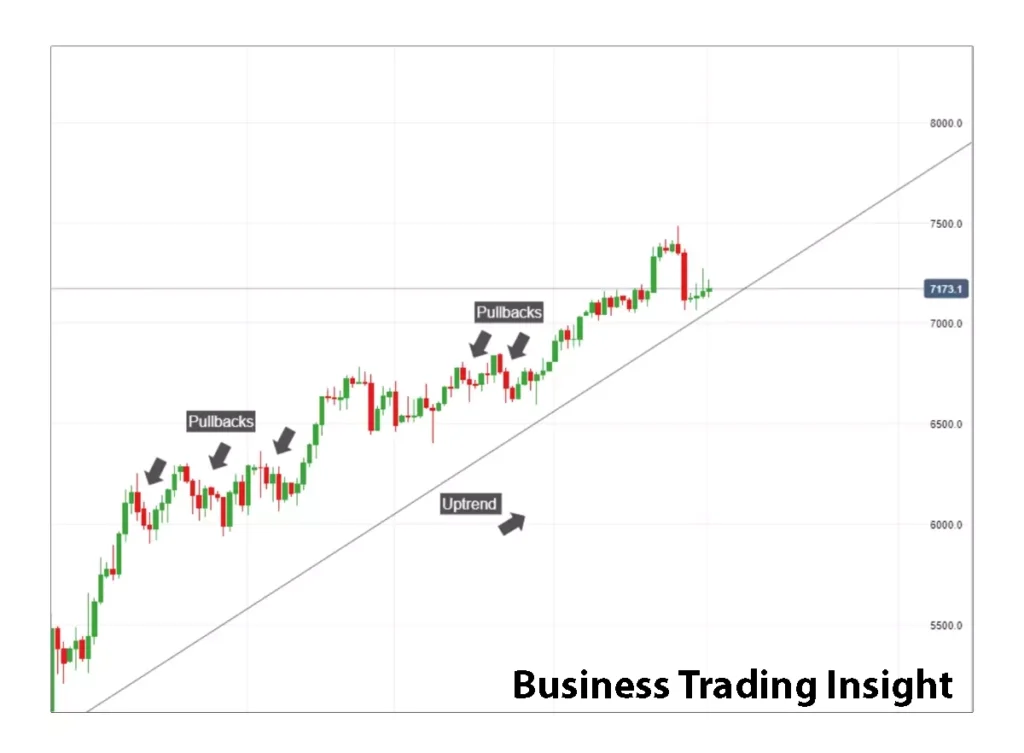
A pullback, in trading terms, refers to a temporary decline in the price of an asset that is moving in the direction of an overall trend. These small corrections often give traders the opportunity to enter the market at a better price point before the price continues its original movement.
Pullbacks can occur in any market, whether it is stocks, forex, commodities, or cryptocurrencies. They are a natural part of the price discovery process and can be seen as brief pauses or «breathers» within an ongoing trend.
The Difference Between a Trend and a Pullback
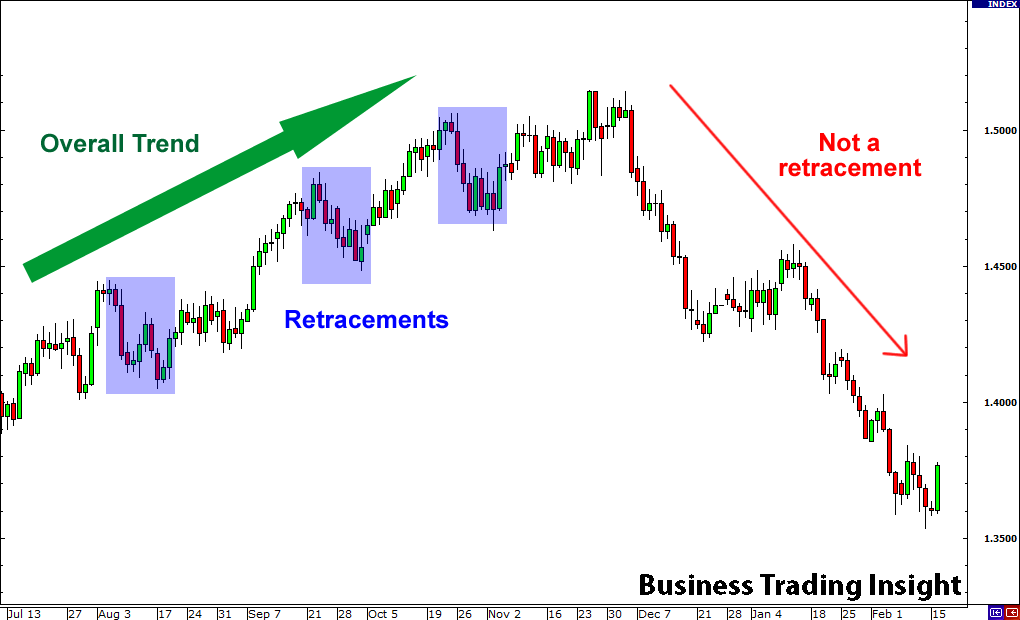
- Trend: A trend is the general direction in which the market is moving over a prolonged period. A trend can be bullish (upward), bearish (downward), or sideways (consolidating).
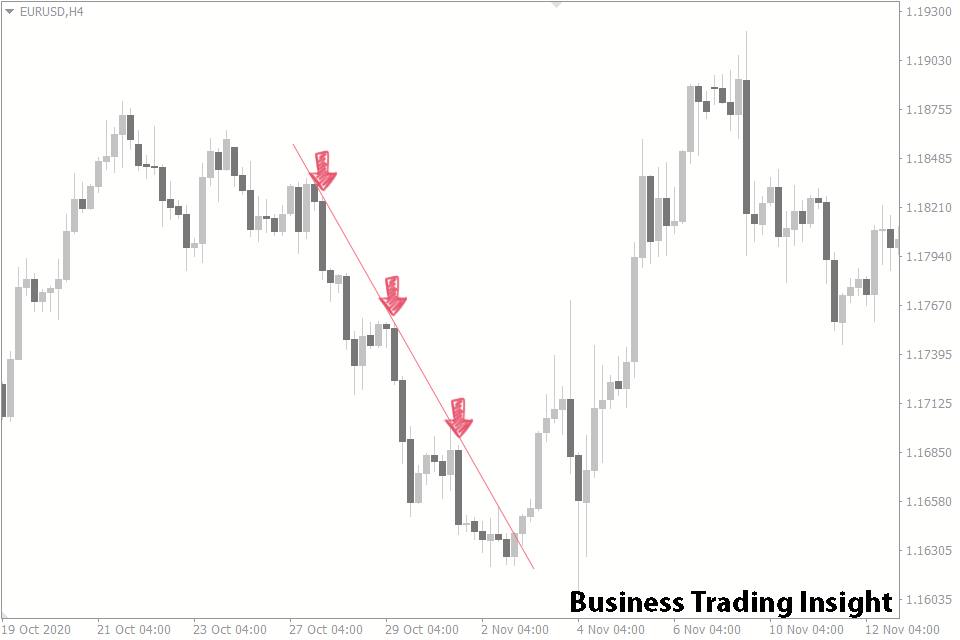
- Pullback: A pullback, on the other hand, refers to a temporary reversal within the trend. In a bullish trend, the pullback will typically be a short-term drop in price, while in a bearish trend, it will be a short-term rise.
The key difference is that pullbacks are temporary and are generally followed by the continuation of the trend. Understanding this distinction is crucial for traders to know when to enter or exit a trade effectively.
Why is Pullback Trading Important?
Pullback trading is important because it allows traders to enter the market at better prices and avoid buying at the peak of a trend or selling at its trough. Without pullbacks, traders would miss out on potential entry points and might be forced to chase the market, often at unfavorable prices.
Furthermore, pullbacks can provide a clearer risk/reward scenario, as the entry is typically made at a lower price within an overall bullish trend or at a higher price within a bearish trend. This minimizes the risk compared to entering the market at the start of a trend, where the price could still move against you.
Overview of the Pullback Strategy
A Brief Introduction to Pullback Trading Strategies
Pullback trading strategies are designed to capitalize on the temporary corrections that occur within a trend. Traders use technical analysis tools and indicators to identify when a pullback is happening and when the trend is likely to continue.
The core idea is to enter the market during a pullback, just before the trend resumes, thereby maximizing the chances of a profitable trade. Pullback traders are often looking for short-term price reversals that fit within the broader trend.
Why Do Traders Use This Strategy?
Pullback trading offers several advantages:
- Better entry prices: By entering during a pullback, traders can buy low in an uptrend or sell high in a downtrend.
- Higher probability of success: Pullbacks are more predictable than trend reversals, which makes the strategy appealing to many traders.
- Clearer risk management: The distance between the pullback entry and the trend’s previous support or resistance can help define risk levels more clearly.
Advantages and Disadvantages of Pullback Trading
Like any trading strategy, pullback trading has its advantages and drawbacks.
Advantages:
- Increased entry accuracy: Pullback strategies allow traders to enter the market closer to key support or resistance levels, improving the chances of a profitable trade.
- Clear risk/reward ratio: By entering during a pullback, traders can calculate their stop-loss and take-profit levels more effectively.
- Widely applicable: Pullback strategies work in virtually every market, from stocks to forex to cryptocurrencies.
Disadvantages:
- False pullbacks: One of the main challenges in pullback trading is distinguishing between genuine pullbacks and false signals, which can lead to losses.
- Market noise: In volatile markets, pullbacks can be exaggerated, making it difficult to identify genuine entry points.
- Patience required: Pullbacks can take time to materialize, and traders need to be patient in waiting for the right setup.
Fundamentals of Pullback Trading
How Pullback Trading Works
Pullback trading works on the premise that prices tend to move in trends. Trends are often interrupted by small corrections that can be exploited. For instance, in an uptrend, the price might drop for a short period before continuing to rise. Traders identify these moments and use them as opportunities to enter at a better price.
The key to successful pullback trading is understanding how and why pullbacks occur:
- Market sentiment shifts: A pullback often occurs because traders are taking profits or adjusting their positions, creating a temporary shift in market sentiment.
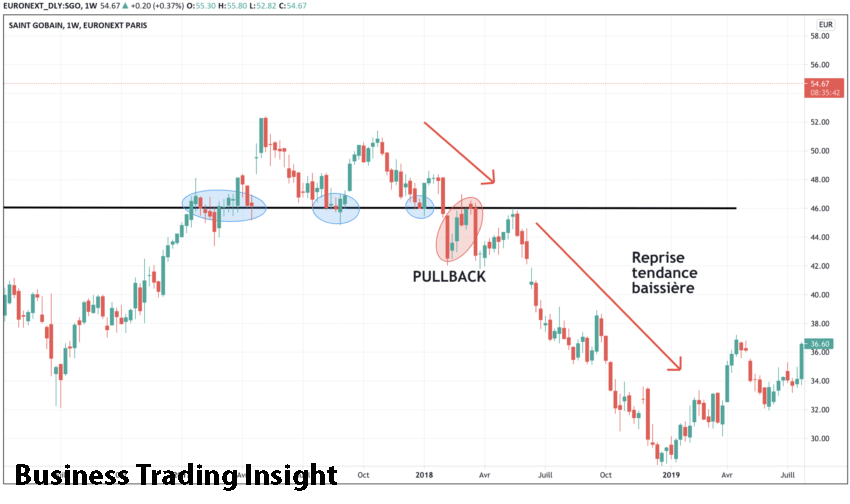
- Support and resistance levels: Prices will often pull back to areas of previous support (in an uptrend) or resistance (in a downtrend) before continuing their trend.
Why Do Pullbacks Occur, and How to Identify Them?
Pullbacks happen for several reasons:
- Profit-taking: As the market moves in one direction, traders might take profits, causing temporary price declines.
- Market consolidation: After a strong move in one direction, the market may consolidate, leading to a pullback.
- Overbought or oversold conditions: In some cases, the market may temporarily reverse to correct overbought or oversold conditions before continuing its trend.
To identify a pullback, traders often look for a price reversal within an established trend, with a subsequent resumption in the direction of the primary trend. The pullback is typically defined by a retracement in price (often between 23.6% and 61.8% on Fibonacci retracement levels).
Types of Trends
Trends can generally be categorized into three main types:
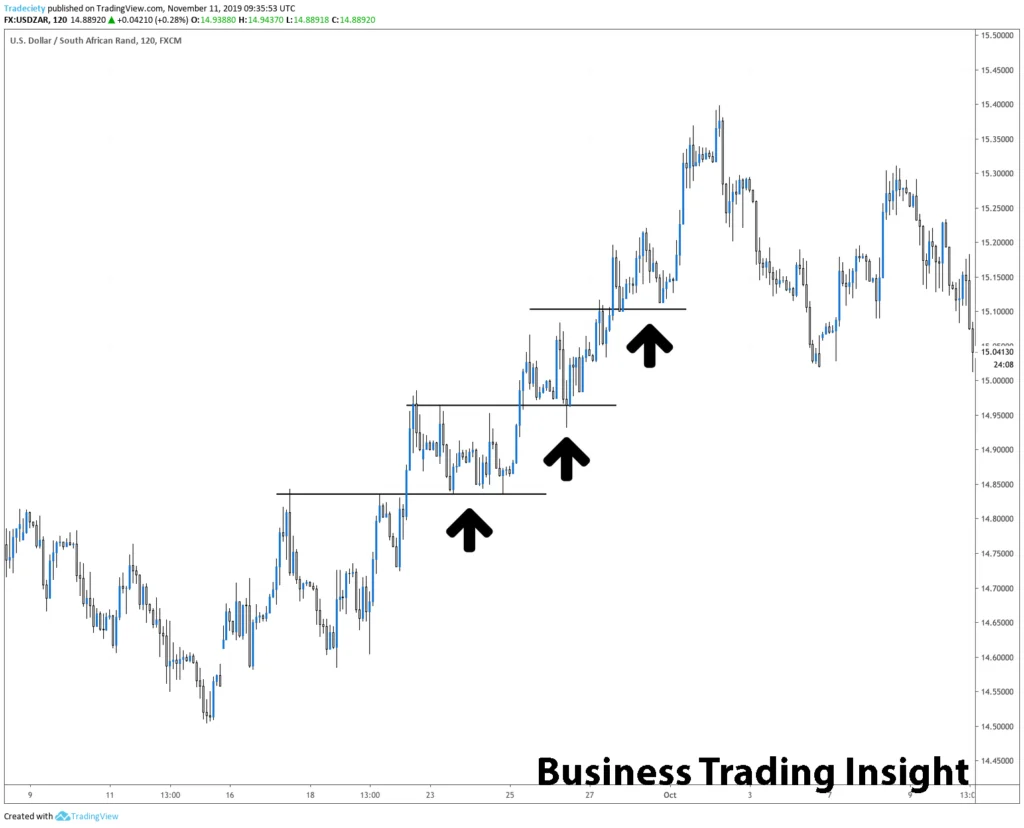
- Bullish Trend: A trend in which the price is consistently rising, characterized by higher highs and higher lows. In a bullish trend, a pullback would typically be a drop in price, followed by a continuation of the upward movement.
- Bearish Trend: A trend in which the price is consistently falling, characterized by lower highs and lower lows. In a bearish trend, a pullback would usually be a temporary rise in price before the downward trend resumes.
- Sideways Trend (Consolidation): A market that is moving within a narrow range without clear upward or downward movement. Pullbacks in a sideways market may be less predictable, as the price action tends to be erratic.
Identifying Entry and Exit Points
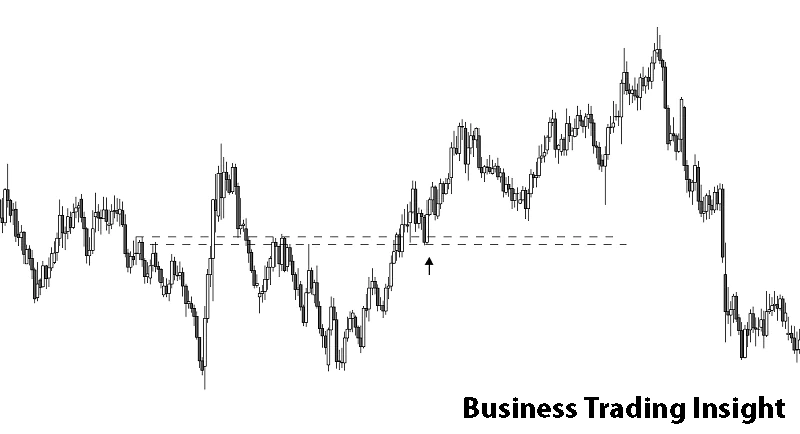
One of the most important aspects of pullback trading is identifying the optimal entry and exit points. Traders typically look for key support or resistance levels where the price is likely to reverse.
- Entry Point: The best entry point occurs when the price has pulled back to a significant level, such as a moving average, Fibonacci retracement level, or a previous support or resistance zone.
- Exit Point: The exit point is usually identified based on the continuation of the trend, often at a previous high or low.
The Importance of Volume in Identifying Pullbacks
Volume plays a crucial role in confirming the strength of a pullback. A pullback accompanied by a decrease in volume might suggest that the correction is weak and unlikely to last, while a pullback with high volume indicates strong participation, suggesting that the pullback is more likely to be a temporary correction.
Using volume indicators like the On-Balance Volume (OBV) or Volume Moving Average can help traders filter out false pullback signals and improve their chances of success.
Approaches to Identifying Pullbacks
Technical Indicators for Identifying Pullbacks
Traders use various technical indicators to spot pullbacks and confirm the continuation of a trend:
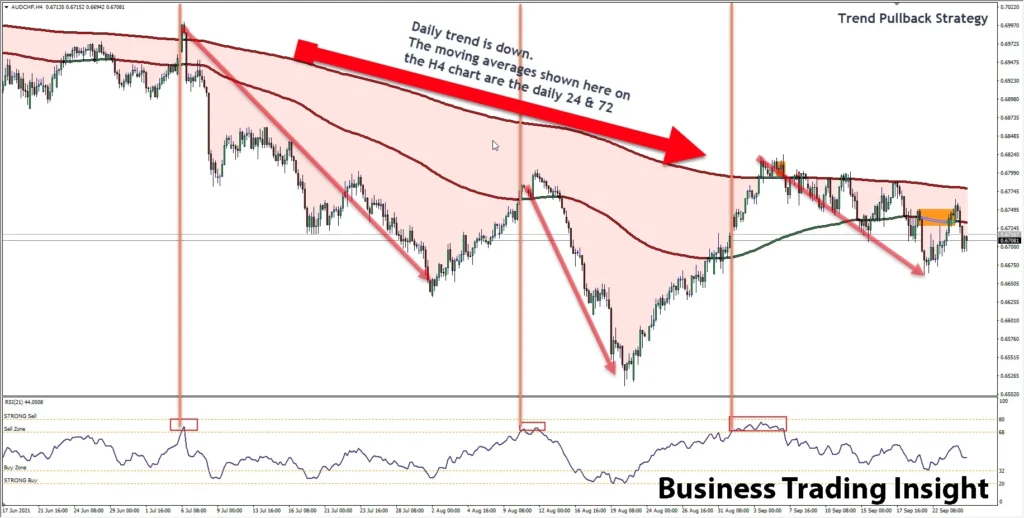
- Moving Averages (SMA, EMA): Simple Moving Averages (SMA) and Exponential Moving Averages (EMA) are often used to identify the trend. When prices pull back to a key moving average, it can signal a potential entry point.
- Support and Resistance Levels: These are horizontal price levels where the market has previously reversed. A pullback to these levels is often a sign of a potential continuation of the trend.
- RSI (Relative Strength Index): The RSI can help identify overbought or oversold conditions. A pullback in a bullish trend might be identified when the RSI moves below 30 (oversold) and then begins to rise again.
- MACD (Moving Average Convergence Divergence): The MACD is useful for identifying changes in momentum and trend direction. Pullbacks are often signaled when the MACD line crosses over the signal line.
Chart Patterns and Formations
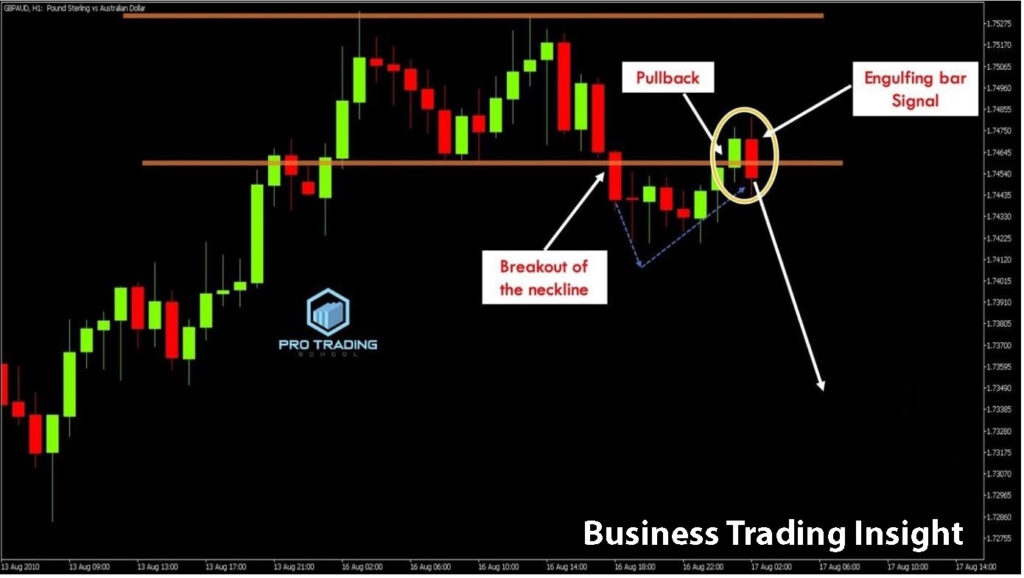
Chart patterns like double tops, head and shoulders, and triangles can also be used to identify pullbacks. These patterns typically signal a reversal or continuation of the trend, helping traders confirm whether a pullback is likely to occur.
Trendlines and Channels: Trendlines help traders identify the direction of the trend and potential pullback zones. Channels help traders determine where the price is likely to pull back to before continuing the trend.
Using Fibonacci Retracement
Fibonacci retracement is one of the most popular tools for identifying pullbacks. Traders use Fibonacci levels (23.6%, 38.2%, 50%, 61.8%) to predict potential pullback levels within an existing trend. These levels are based on the idea that markets tend to retrace a predictable portion of a prior move before continuing in the direction of the trend. By applying Fibonacci retracement to a major move (up or down), traders can identify key levels where the price may pull back before resuming its trend.
For example, in a bullish trend, a pullback to the 38.2% or 50% Fibonacci level often presents a good entry point for traders, as it allows them to buy at a relatively lower price before the trend resumes. Similarly, in a bearish trend, a pullback to these Fibonacci levels could offer an opportunity to sell before the downward movement continues.
Pullback Trading Strategies
Classic Pullback Strategy
The classic pullback strategy involves entering the market during a pullback in the direction of the overall trend. Traders typically wait for the price to retrace to a key level of support (in an uptrend) or resistance (in a downtrend), and then look for signs that the trend is resuming.
Here’s a basic approach:
| Step | Description | Action | Tools/Methods |
| 1. Identify the Trend | Ensure the market is in a clear uptrend or downtrend. | Check the direction of the price movement (up or down). | Trendlines, Moving Averages (MA), Trend indicators. |
| 2. Wait for a Pullback | The price should temporarily move against the trend, retracing 23.6%–61.8% of the previous move. | Monitor the chart for price corrections. | Fibonacci retracement, Support and Resistance levels. |
| 3. Confirm the Pullback | Use indicators to confirm the pullback. | Confirm the pullback using indicators like MA, RSI, or Fibonacci levels. | Moving Averages (MA), Relative Strength Index (RSI), Fibonacci retracement. |
| 4. Enter the Trade | Once the pullback shows signs of ending (e.g., a reversal candlestick pattern or bounce off a moving average), enter the trade in the direction of the primary trend. | Look for entry signals: candlestick patterns (hammer, engulfing), bounce off a moving average. | Candlestick patterns, Moving Averages, Trend reversal signals. |
| 5. Set Stop Loss and Take Profit | Place stop-loss orders below the recent low (in an uptrend) or above the recent high (in a downtrend), and set take-profit at logical levels (e.g., next resistance or support). | Set protective stop-loss and take-profit targets. | Recent high/low, Support/Resistance levels, Risk-to-Reward ratio. |
Example of a Trading Strategy Using Indicators
Let’s take an example of a pullback strategy using Moving Averages and RSI:
- Moving Averages: Use the 50-period simple moving average (SMA) to identify the trend. If the price is above the 50-SMA, the market is in an uptrend, and if it’s below the 50-SMA, the market is in a downtrend.
- RSI: Use the RSI to confirm if the market is overbought or oversold. In an uptrend, a pullback may occur when the RSI falls below 30 (oversold), suggesting an opportunity to buy. In a downtrend, the RSI may rise above 70 (overbought), signaling a potential sell opportunity.
By combining these two indicators, you can enter a trade when the price is in a pullback phase but is still within the bounds of the primary trend. This helps increase the probability of success.
Risk Management in Pullback Trading
Risk management is crucial when trading pullbacks, as they can sometimes be short-lived or lead to false breakouts. To mitigate risk, traders should focus on:
- Setting Stop Losses: Always place a stop loss below the entry point (in an uptrend) or above the entry point (in a downtrend) to protect against unexpected reversals. This helps to limit losses in case the market doesn’t resume the trend as expected.
- Position Sizing: Carefully determine the size of each trade based on your risk tolerance and the distance to the stop-loss level. A typical guideline is to risk no more than 1-2% of your trading capital on a single trade.
- Take-Profit Targets: Establish clear take-profit levels based on market structure, such as previous support or resistance zones. This allows for a balanced risk/reward ratio, which is essential for long-term profitability.
The Psychology of Pullback Trading
Psychological Aspects of Pullback Trading
Pullback trading requires a specific mindset to succeed. Traders must be patient, disciplined, and able to handle the uncertainty that comes with waiting for pullbacks to occur. Here are some psychological factors to consider:
- Patience: Pullbacks don’t always happen on demand, and traders need to wait for the right conditions to enter. Impatience can lead to entering trades too early, increasing the risk of loss.
- Avoiding Overconfidence: It can be tempting to think you’ve found the «perfect» pullback, but overconfidence can lead to poor decision-making and chasing after false signals.
- Emotional Control: Pullback trading requires emotional discipline. Traders should not panic if the price moves against them during a pullback. Sticking to the plan and following the strategy is key.
Trader Psychology: Pullback as an Opportunity or Danger?
The psychological aspect of pullback trading often revolves around whether the pullback is seen as an opportunity or a danger. Many traders can fall into the trap of assuming that every pullback is a buying or selling opportunity without considering market conditions.
- Risk Acceptance: Pullback traders need to be comfortable with the possibility that the pullback may not always lead to a continuation of the trend. Losses are part of the game, and managing them effectively is crucial.
- Avoiding Impulsive Decisions: Impulsive decisions often come from emotional reactions to market movements. A clear trading plan with defined entry, exit, and stop-loss levels can help reduce emotional decision-making.
Mistakes and Risks in Pullback Trading
Mistakes of Novice Traders
Novice traders often make common mistakes when trading pullbacks. Some of these mistakes include:
- Premature Market Entries: Entering a trade too early during a pullback can be risky. It’s important to wait for confirmation that the trend will resume before entering.
- Ignoring Market Conditions: Ignoring the broader market context can lead to poor trades. For instance, trying to trade a pullback during a strong bearish trend can be dangerous, as the pullback may turn into a trend reversal.
- Chasing Pullbacks: Some traders may rush to enter trades during pullbacks, only to realize that the price has already retraced too much and the risk/reward ratio no longer makes sense.
False Signals and Fake Pullbacks
False pullbacks can often lead traders to enter bad trades. Here’s how to identify fake pullbacks:
- Price Action: A false pullback often shows weak price action, like a lack of momentum after the reversal. Price may fail to break previous support or resistance, suggesting that the pullback was not genuine.
- Volume: Pullbacks with low volume often indicate weak interest in the market, suggesting that the move may not last and could be a false signal.
To avoid false pullbacks, traders should combine multiple technical indicators and pay attention to volume and market sentiment.
How to Minimize Risks
To reduce the risk of false pullbacks and other mistakes, traders can:
- Filter Signals: Use multiple indicators, such as moving averages, RSI, and Fibonacci retracement, to confirm the pullback before entering.
- Diversify: Don’t rely solely on pullback trading. Diversify your strategies and trading instruments to reduce exposure to market fluctuations.
- Hedging: Use hedging strategies, such as options or inverse ETFs, to protect against unexpected market movements.
Real-Life Examples and Case Studies
Example of a Successful Pullback Trade
Let’s analyze a successful pullback trade using the classic pullback strategy:
| Step | Description | Action | Tools/Methods |
| 1. Identify the Trend | The market is in a strong uptrend, and the price is above the 50-period moving average. | Confirm that the price is above the 50-period moving average and trending upwards. | 50-period Moving Average (MA), Trend analysis. |
| 2. Wait for the Pullback | The price retraces to the 38.2% Fibonacci level, showing signs of a reversal. | Monitor the chart for a price retracement to the 38.2% Fibonacci level. | Fibonacci retracement, Price action. |
| 3. Confirmation | The RSI falls below 30, signaling an oversold condition, and then starts to rise, confirming the pullback is ending. | Wait for the RSI to drop below 30 (oversold), then begin rising. | Relative Strength Index (RSI), Fibonacci retracement. |
| 4. Enter the Trade | A buy order is placed once the price starts moving upward from the pullback zone. | Enter a long position when the price starts moving up after the pullback. | Buy order, Trend continuation signals. |
| 5. Exit the Trade | The price reaches a previous resistance level, providing a clear exit point. | Set a take-profit target at a previous resistance level. | Support/Resistance levels, Price action. |
This trade worked out because the trader patiently waited for the pullback to end, confirmed the entry using multiple indicators, and set a reasonable take-profit target based on market structure.
Example of a Failed Trade
On the other hand, here’s an example of a failed pullback trade:
- Identify the Trend: The market is in a downtrend, but the trader does not wait for sufficient confirmation.
- Premature Entry: The trader enters the trade too early, assuming the pullback is over, but the price moves higher.
- False Pullback: The pullback turns out to be a false signal, and the price continues to rise instead of falling, leading to a loss.
This failure highlights the importance of waiting for confirmation before entering a trade and being cautious about premature entries.
Conclusion
Advantages and Disadvantages of Pullback Strategy
Pullback trading is a powerful strategy when used correctly. It allows traders to enter at favorable price levels within a trend and offers a clear risk/reward scenario. However, it also requires patience, emotional control, and a solid understanding of market dynamics.
When to Use Pullback Trading: Pullback trading is suitable for traders who are comfortable with waiting for the right setup and who can manage risk effectively. It works best in trending markets and when technical indicators align to confirm the pullback.
Tips for Beginner Traders: Start by practicing pullback trading in demo accounts before risking real capital. Focus on learning key indicators, market trends, and risk management principles.
The Future of Pullback Trading in Changing Market Conditions
As markets evolve and volatility increases, pullback trading will need to adapt. Traders may need to adjust their strategies to account for higher market noise, rapid trend shifts, and more frequent pullbacks. Staying informed and continuously refining strategies will help traders stay ahead in a dynamic market environment.


