In trading, technical analysis is essential for making informed decisions, and one of its core elements is candlestick patterns. Among these, the Piercing Line Pattern stands out as a powerful tool for identifying potential trend reversals — particularly transitions from bearish to bullish market conditions.
In this article, we’ll break down the Piercing Line Pattern: what it is, how to spot it on a chart, how to use it in your trading strategy, and how to confirm its validity with other indicators. Whether you’re new to trading or an experienced investor, understanding this pattern can open up opportunities for more successful trades.
What is the Piercing Line Pattern?
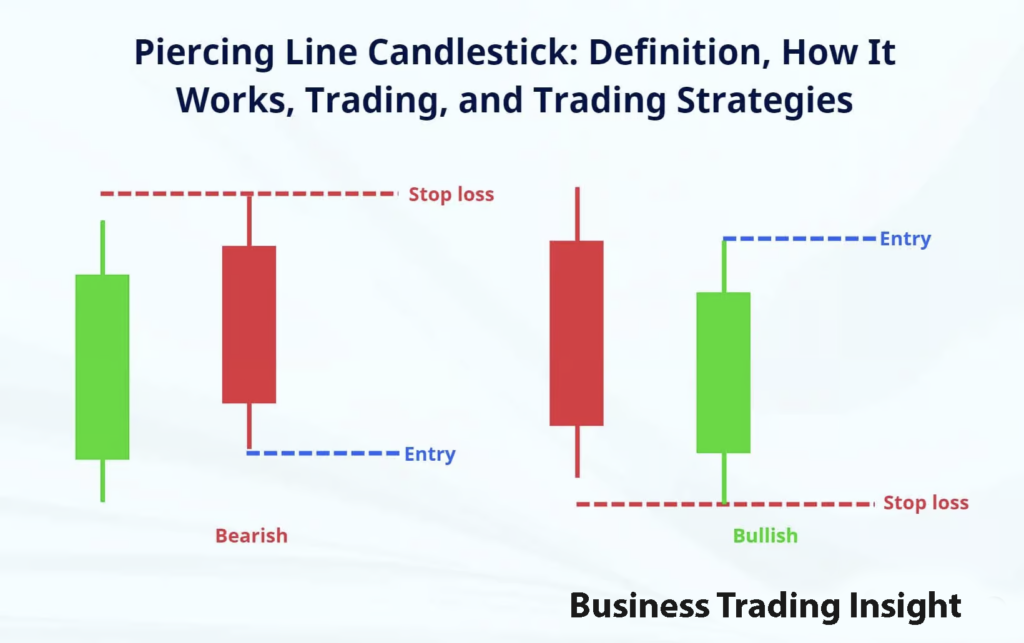
The Piercing Line Pattern is a two-candle reversal formation that indicates a potential shift from a downtrend to an uptrend. This pattern typically appears after a prolonged bearish market and consists of two candles:
- The first candle is a long bearish (down) candle, confirming the market’s downward momentum.
- The second candle is a bullish (up) candle that opens below the first candle’s close but closes above the midpoint of the first candle’s body.
Visual Characteristics
- Bearish Candle (First Candle): The first candle in the pattern is bearish and reflects strong selling pressure, confirming the market is in a downtrend.
- Bullish Candle (Second Candle): The second candle is bullish and opens lower than the close of the first candle, but it closes above the midpoint of the first candle’s body. This indicates that the bulls are starting to take control of the market.
This shift in momentum is a clear signal that the trend may be reversing, making it a valuable tool for traders looking for a buying opportunity.

How to Interpret the Piercing Line Pattern
The Piercing Line Pattern is generally seen as a reversal signal. Here’s how to interpret it effectively:
Trend Reversal Signal
When the Piercing Line Pattern forms, it suggests that the bearish momentum is weakening and the market may soon reverse course. The second bullish candle’s close above the first candle’s midpoint indicates that buyers are regaining control, signaling the potential for a shift from a downtrend to an uptrend.
Why It’s Considered a Buy Signal
Traders view the Piercing Line Pattern as a buying signal because it shows that the selling pressure is fading. When the second bullish candle closes above the midpoint of the first bearish candle, it suggests that the buyers have overwhelmed the sellers, indicating a potential rally.
Psychological Drivers Behind the Pattern
The Piercing Line Pattern is rooted in market psychology. The first bearish candle represents fear and pessimism, while the second bullish candle shows a shift toward optimism, with buyers pushing prices higher. This shift in sentiment is what makes the pattern so significant for traders looking for trend reversals.

Conditions for the Piercing Line Pattern to Appear
For the Piercing Line Pattern to be a valid signal, certain conditions must be met:
Prior Bearish Trend
The pattern is most reliable when it appears after a downtrend. A downtrend creates the necessary market context for a reversal. Without a bearish trend leading up to the pattern, the signal may be less meaningful.
Confirmation with Other Indicators
The Piercing Line Pattern can be a strong signal, but it’s essential to confirm it with other technical tools. Look for volume spikes or confirm the pattern with indicators such as the RSI (Relative Strength Index) or MACD (Moving Average Convergence Divergence). These indicators help validate the reversal and increase the likelihood of a successful trade.
Context Matters: Support and Market Conditions
The context in which the pattern forms is equally important. A Piercing Line Pattern that forms near a strong support level or during oversold conditions is more likely to signal a genuine reversal. Always consider the broader market environment and the current price action before acting on the pattern.

How to Use the Piercing Line Pattern in Trading
Once you’ve identified the Piercing Line Pattern, it’s crucial to know when and how to act on it. Here’s a practical guide for incorporating this pattern into your trading strategy:
Entering a Trade: Timing Your Entry
The best time to enter a trade is after the second candle closes. To confirm the reversal, traders typically wait for the price to close above the high of the second candle. This ensures that the bullish momentum has taken hold and the trend reversal is likely to continue.
Example Trading Strategy
Let’s say the Piercing Line Pattern forms at a key support level, and the RSI indicator is showing an oversold condition (below 30). These additional confirmations increase the chances of a successful reversal. In this case, a trader might enter a long position after the second candle closes, with a stop-loss set just below the low of the second candle.
Risk Management: Stop-Loss and Take-Profit
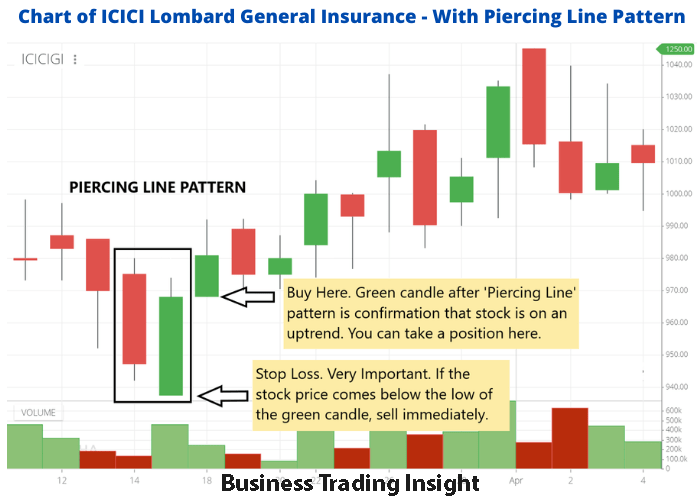
For effective risk management, set your stop-loss just below the low of the second candle. This limits your potential losses if the market reverses unexpectedly. For take-profit, traders can aim for the next resistance level or use a risk-reward ratio, such as 2:1, to determine an appropriate profit target.
Combining with Other Candlestick Patterns
The Piercing Line Pattern can be even more reliable when used in combination with other candlestick patterns. For example, if a Piercing Line Pattern forms after a Hammer or Inverted Hammer, it strengthens the potential for a bullish reversal. Using multiple patterns together increases the accuracy of your trading signals.
Advantages and Limitations of the Piercing Line Pattern
Like any technical indicator, the Piercing Line Pattern has both advantages and limitations.
Advantages:
- Simple to Spot: The pattern is straightforward and easy to identify on a chart.
- Reliable Trend Reversal Indicator: When interpreted correctly, it can effectively signal a reversal from bearish to bullish, providing high-quality trade opportunities.
Limitations:
- False Signals in Volatile Markets: The Piercing Line Pattern can occasionally produce false signals, especially in volatile or low-volume markets. Confirmation with additional indicators is essential to avoid these false signals.
- Context is Key: The pattern is more reliable when it appears at key support levels or during oversold conditions. Without this context, the pattern may not lead to a successful trade.
- Volume Considerations: Lack of volume confirmation can reduce the reliability of the signal. Always check volume to validate the pattern’s strength.

Real-World Examples of the Piercing Line Pattern
Here’s an example of how the Piercing Line Pattern works in practice:
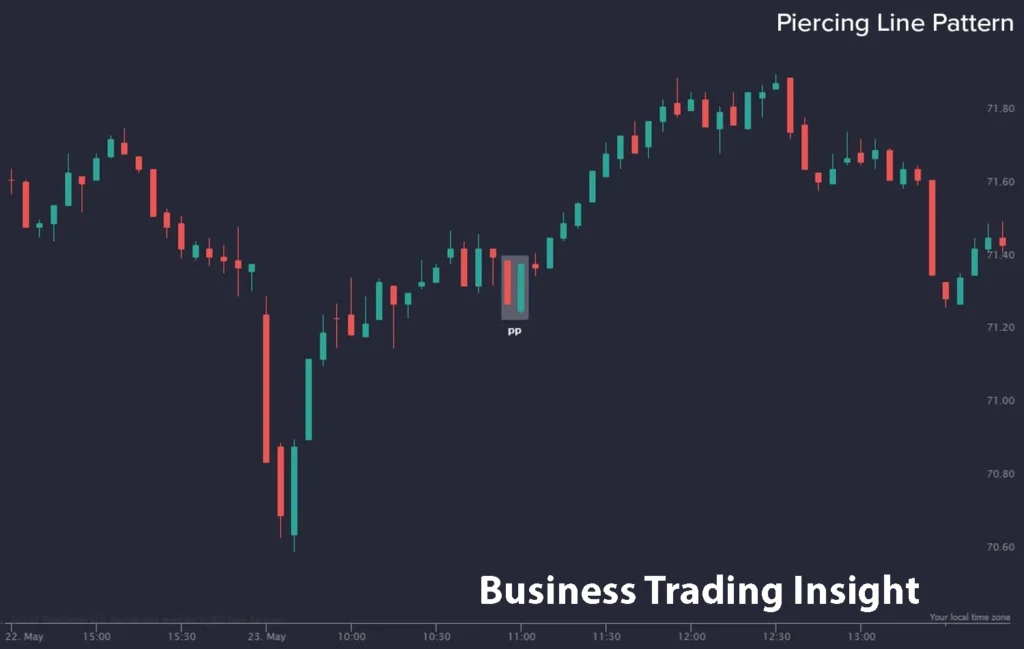
In a stock chart, the market has been in a downtrend for several days. A long bearish candle forms, followed by a bullish candle that opens lower but closes above the midpoint of the bearish candle. Volume spikes on the second candle, confirming the change in momentum. A trader might then enter a buy position, placing a stop-loss below the low of the second candle to protect against any sudden market moves.
When the Pattern Fails
Not all Piercing Line Patterns result in a successful reversal. In some cases, the pattern may fail, especially if the market is in a highly volatile or overbought condition. Always use additional indicators and market context to assess the validity of the pattern.
Piercing Line Pattern in Different Market Conditions
The Piercing Line Pattern behaves differently depending on market conditions:
Timeframe Considerations
The Piercing Line Pattern is more reliable on higher timeframes, such as daily or 4-hour charts. These timeframes provide a clearer indication of a trend reversal. On lower timeframes, the pattern might be less significant due to market noise and short-term fluctuations.
Liquidity and Volatility
In highly liquid markets, the Piercing Line Pattern is generally more reliable. In markets with low liquidity or high volatility, false signals may occur more frequently. Always consider broader market conditions and adjust your strategy accordingly.
Conclusion
The Piercing Line Pattern is a valuable tool for traders looking to identify potential trend reversals, especially from bearish to bullish. By understanding its visual characteristics and confirming it with other technical indicators, traders can effectively use it to time market entries.
However, like all technical patterns, the Piercing Line Pattern is not foolproof. It is essential to use it in the right context — after a downtrend, at support levels, or during oversold conditions—and confirm it with additional indicators. Risk management strategies, such as stop-loss and take-profit orders, are also crucial to protect against false signals and unexpected market movements.
With proper understanding and application, the Piercing Line Pattern can be a powerful tool in any trader’s arsenal.


