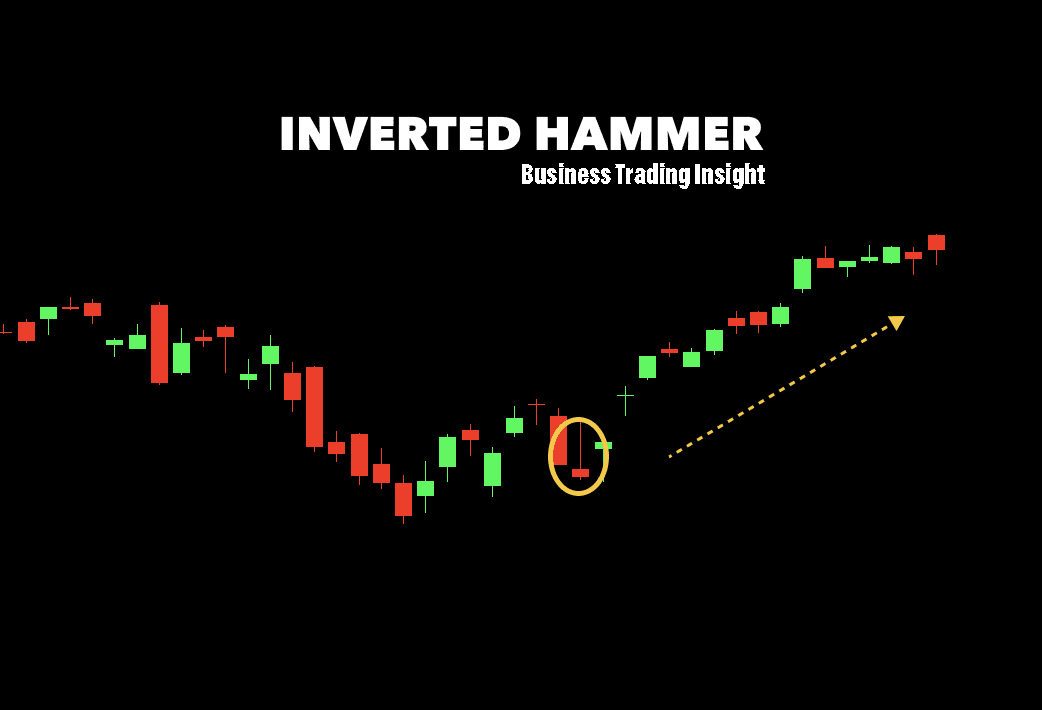
In the intricate world of technical analysis, mastering specific patterns can significantly enhance your trading strategy. One such pattern is the Inverted Hammer. This article delves deep into the Inverted Hammer candlestick, exploring its structure, significance, effective trading strategies, and how it compares with other candlestick patterns.
What Is the Inverted Hammer Candlestick?
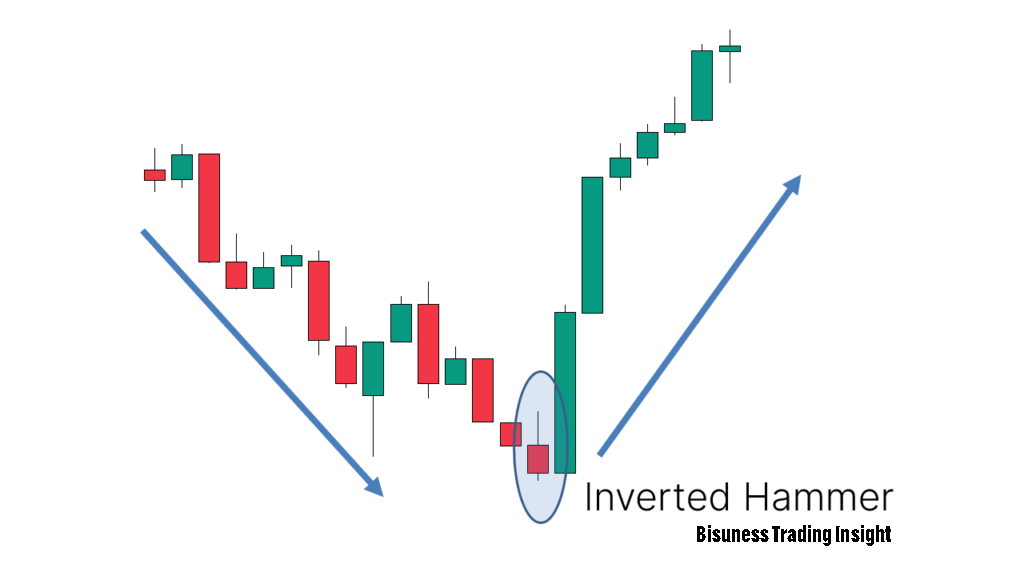
The Inverted Hammer is a single-candlestick pattern that often appears in downtrends, signaling potential bullish reversals. Characterized by a small body at the lower end of the trading range and a long upper shadow, it indicates that buyers attempted to push the price higher but were ultimately unsuccessful, resulting in a close near the open price. This struggle between buyers and sellers is crucial for traders to understand, as it provides insights into market sentiment.
What Does the Inverted Hammer Look Like?
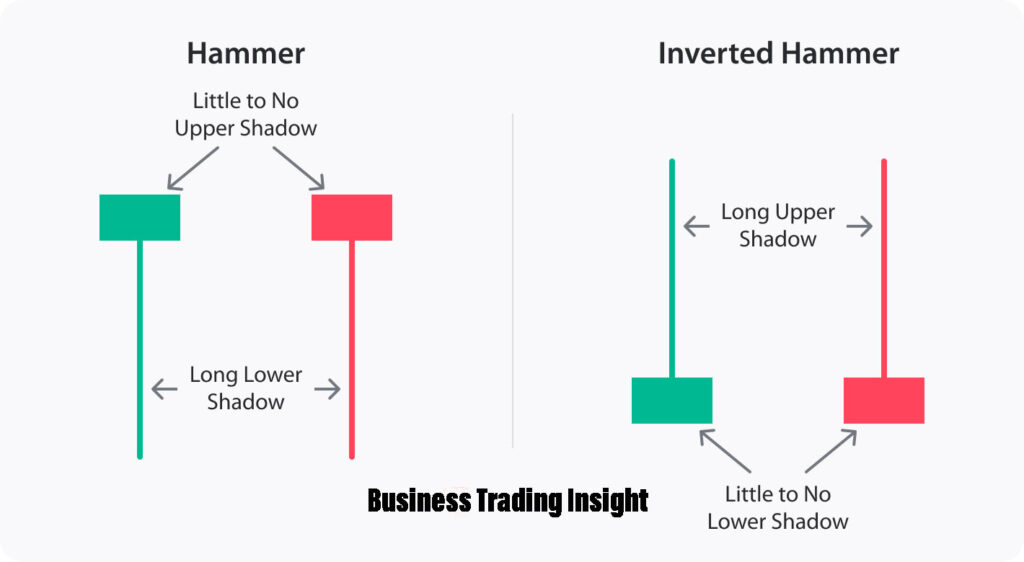
Visually, the Inverted Hammer is distinctive and easy to recognize on charts. It features:
- A small body: The body can be red (bearish) or green (bullish), but its size should be small compared to the shadow.
- A long upper shadow: This shadow should be at least twice the length of the body, reflecting the struggle between buyers and sellers during the session.
- No lower shadow: Ideally, there is little to no shadow at the bottom, suggesting that selling pressure was minimal.
This combination makes the Inverted Hammer easy to identify, particularly for traders looking to capitalize on potential reversals.
Key Characteristics of the Inverted Hammer
| Feature | Description |
|---|---|
| Body Size | Small relative to the shadow; can be green or red |
| Upper Shadow | Long (at least twice the body length) |
| Lower Shadow | Little to none |
| Market Context | Typically found in downtrends |
| Confirmation Needed | Subsequent bullish candle for validation |
How is an Inverted Hammer Candlestick Pattern Structured?
The structure of the Inverted Hammer can be broken down as follows:
- Open: The price opens lower, usually within the body or close to the lower range.
- Upward movement: Buyers push the price up significantly, forming the long upper shadow. This demonstrates the buying pressure present during the session.
- Close: The price then retreats, closing near the opening level, which is crucial for validating the pattern.
Understanding this structure highlights the psychological battle between buyers and sellers.
How Reliable is an Inverted Hammer in Technical Analysis?
The reliability of the Inverted Hammer depends on several factors, including market conditions and confirmation from subsequent candles. It is generally more reliable when:
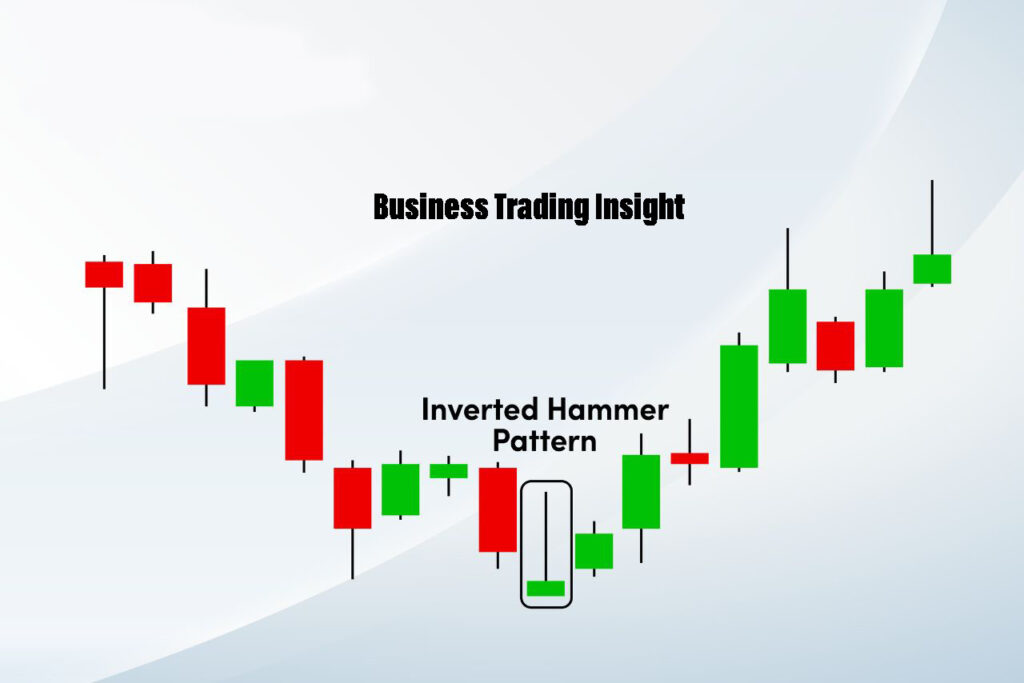
- Found at the bottom of a downtrend: The pattern is most effective after a significant decline. For instance, if a stock has been in a bearish trend and then forms an Inverted Hammer, this could signal that a reversal might be near.
- Accompanied by high trading volume: Increased volume adds credibility to the pattern, suggesting that many traders recognize the potential reversal. A high-volume Inverted Hammer indicates strong buyer interest, making the signal more reliable.
However, like any technical analysis tool, the Inverted Hammer is not foolproof. Traders should stay vigilant about overall market context and be prepared for potential false signals.
How Accurate is the Inverted Hammer Candlestick Pattern in Technical Analysis?
The accuracy of the Inverted Hammer varies but can be quite high when combined with other technical indicators. For example, studies show that when traders observe an Inverted Hammer followed by a strong bullish candlestick, the likelihood of a reversal increases significantly.
Consider this: If an Inverted Hammer is followed by a strong green candle with high volume, it often confirms the bullish reversal. Conversely, if there’s no confirmation, traders might face a false signal, leading to potential losses. Therefore, it’s crucial to combine the Inverted Hammer with indicators like the Relative Strength Index (RSI) or Moving Averages to enhance the accuracy of trades based on this pattern.
When Does the Inverted Hammer Candlestick Pattern Occur?
The Inverted Hammer typically occurs in specific market conditions, primarily during downtrends. Its appearance signals that buyers are stepping in to halt the downward momentum. However, it’s essential to wait for confirmation from the following candlestick. If the next candle is bullish, it reinforces the likelihood of a trend reversal.
For example, if a stock has seen several days of decline, the emergence of an Inverted Hammer followed by a bullish candlestick can provide traders with a strong signal to enter a long position.
Is an Inverted Hammer Candlestick Pattern a Bullish Reversal?
Yes, the Inverted Hammer is widely regarded as a bullish reversal pattern. When it appears after a sustained downtrend, it indicates a shift in market sentiment, with buyers beginning to gain strength. To confirm this reversal, traders should look for subsequent bullish candles to validate the signal.
Imagine seeing an Inverted Hammer forming after a stock has dropped significantly. If the following candle closes higher, it could be a cue to enter a long position, anticipating further upward movement.
Green vs. Red Inverted Hammer
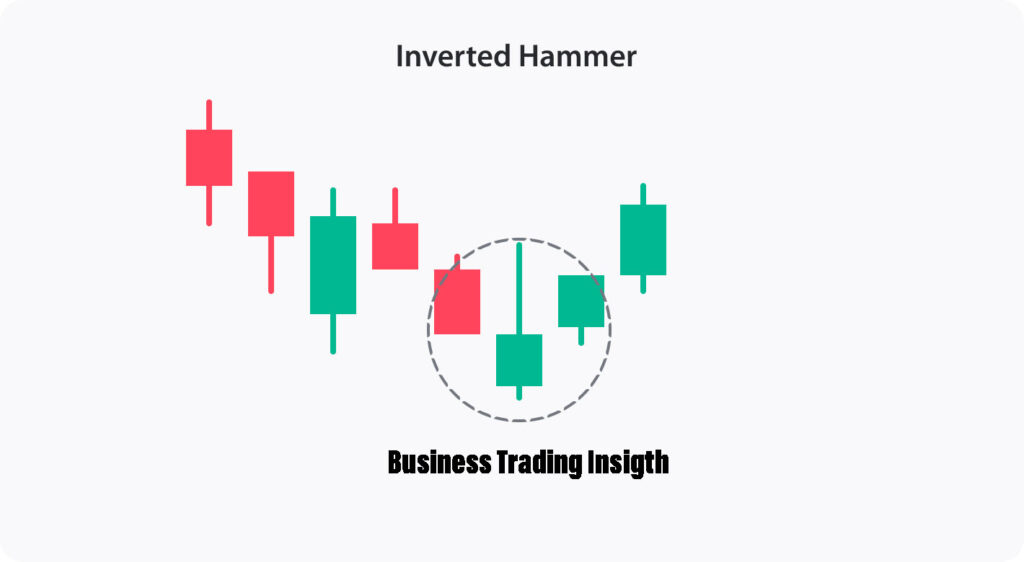
The color of the Inverted Hammer’s body (green or red) can provide additional insights into market sentiment:
- Green Inverted Hammer: Suggests stronger bullish sentiment, as the close is above the open. This typically makes it a more reliable reversal signal.
- Red Inverted Hammer: Indicates that the price closed below the opening price, reflecting bearish sentiment. While still a potential reversal signal, it may require additional confirmation from subsequent candles.
Both types of Inverted Hammers can indicate potential reversals, but the green version is often viewed as a stronger signal. Understanding the implications of each color helps traders make more informed decisions.
How to Read the Inverted Hammer Candlestick Pattern in Technical Analysis?
Reading the Inverted Hammer involves understanding its context and analyzing surrounding price action:
- Location: Look for the pattern at the end of a downtrend. Its effectiveness is heightened in this context.
- Confirmation: Wait for a subsequent bullish candle to validate the reversal signal. A strong bullish candle following the Inverted Hammer strengthens the case for entering a long position.
- Volume: Check the volume associated with the Inverted Hammer. Higher volume can indicate stronger conviction in the pattern, which adds to its reliability.
By following these steps, traders can effectively incorporate the Inverted Hammer into their analysis and trading strategies.
How to Trade with Inverted Hammer Candlestick Patterns in the Stock Market?
Trading with the Inverted Hammer can be effective if done correctly. Here are some steps to follow:
- Identify the pattern: Look for an Inverted Hammer in a downtrend, particularly near a support level for added confirmation.
- Wait for confirmation: Ensure the following candle is bullish to validate the reversal. The stronger the confirmation, the better.
- Set entry and exit points: Consider entering the trade at the close of the confirmation candle, with stop-loss orders set below the Inverted Hammer’s low to manage risk effectively.
- Monitor the trade: Keep an eye on market conditions and adjust your strategy as necessary. If the trade moves in your favor, consider trailing your stop-loss to lock in profits.
Example of an Inverted Hammer Candlestick Pattern in Trading
Let’s consider a practical example to illustrate the application of the Inverted Hammer:
Imagine a stock that has been in a downtrend for several weeks, declining from $50 to $30. One day, you notice an Inverted Hammer forming at the $30 support level. The following day, the stock opens at $30.50 and closes at $32, confirming the bullish reversal. Recognizing this as a potential trend reversal, you decide to enter a long position at the close of the confirmation candle, placing a stop-loss at $29.
As the price rises in the following days, you can either take profits at a predetermined target or adjust your stop-loss to secure gains, effectively capitalizing on the reversal signal provided by the Inverted Hammer.
Advantages of the Inverted Hammer Candlestick
The Inverted Hammer offers several advantages for traders:
- Potential for early reversal signals: It can indicate shifts in market sentiment before significant price moves, allowing traders to enter positions early.
- Versatility: Applicable to various markets, including stocks, forex, and commodities, making it a useful tool across different trading styles.
- Simplicity: Easy to identify, even for novice traders. The straightforward nature of the Inverted Hammer makes it accessible for those new to technical analysis.
Disadvantages of the Inverted Hammer Candlestick
Despite its advantages, the Inverted Hammer has limitations:
- False signals: It can generate misleading signals, particularly in volatile markets or when there is a lack of confirmation from subsequent candles.
- Requires confirmation: Traders must wait for subsequent candles to validate the pattern, which can delay entry and reduce potential rewards.
- Subject to market conditions: Its effectiveness can vary based on overall market trends and news events, making it crucial for traders to remain aware of external factors that might influence price action.
Is a Shooting Star the Same as an Inverted Hammer?
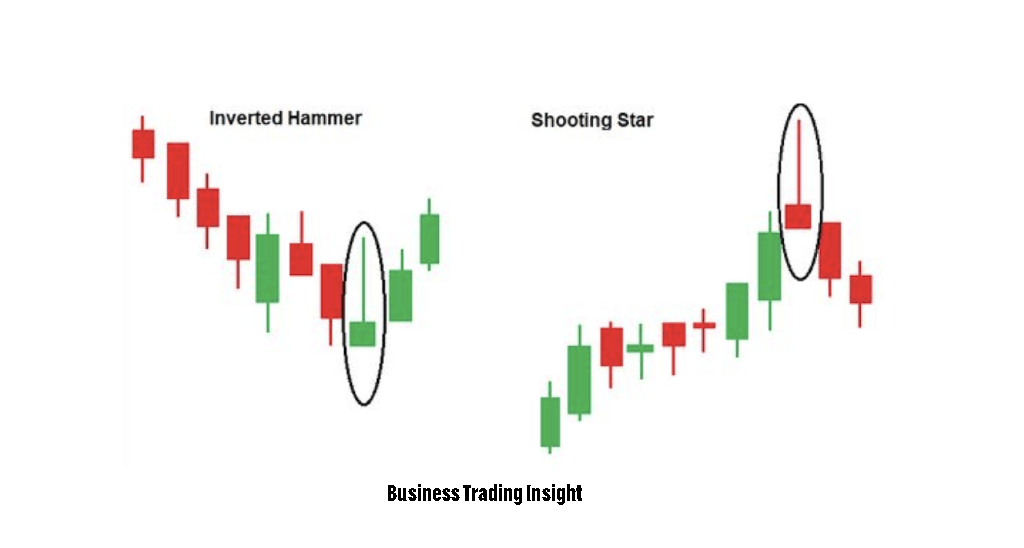
While the Shooting Star and Inverted Hammer share similarities in appearance, they serve different purposes. The Shooting Star appears at the top of an uptrend and signals a potential bearish reversal, while the Inverted Hammer occurs at the bottom of a downtrend and signals a potential bullish reversal. Understanding this distinction is crucial for accurate trading decisions, as misinterpreting these patterns can lead to significant losses.
Other Candlestick Patterns to Know
In addition to the Inverted Hammer, traders should familiarize themselves with various other candlestick patterns, such as:
- Doji: Indicates indecision in the market, often signaling a potential reversal or continuation based on subsequent price action.
- Hammer: Similar to the Inverted Hammer but appears in uptrends, signaling potential bearish reversals.
- Engulfing patterns: These patterns signal potential reversals based on the engulfing of previous candles, offering traders additional tools for their analysis.
These patterns can complement the analysis of the Inverted Hammer and provide additional trading opportunities. By understanding the nuances of various candlestick patterns, traders can make more informed decisions and refine their strategies.
How to Trade on an Inverted Hammer Candlestick?
To effectively trade using the Inverted Hammer, follow these steps:
- Identify the pattern in a downtrend, looking for additional context such as support or resistance levels.
- Confirm with a bullish candle before entering a trade. Strong bullish confirmation enhances the likelihood of a successful reversal.
- Set clear entry and exit points, ensuring your risk management strategies are in place to protect your capital.
- Monitor the trade closely and adjust your strategy based on market movements. Flexibility and responsiveness are crucial in trading.
By applying these principles, traders can enhance their chances of successful trades using the Inverted Hammer candlestick.
The Inverted Hammer is a powerful tool in a trader’s arsenal. By understanding its structure, significance, and how to effectively trade with it, you can enhance your technical analysis skills and make informed trading decisions. Whether you’re a novice or an experienced trader, mastering the Inverted Hammer can lead to improved trading outcomes.
FAQ
How does the Inverted Hammer look?
The Inverted Hammer has distinctive characteristics:
- Small body: The body of the candle can be either red (bearish) or green (bullish) but should be relatively small.
- Long upper shadow: This shadow should be at least twice the length of the body, reflecting significant upward movement during the session despite the close being near the open.
- Almost no lower shadow: Ideally, there should be little to no shadow at the bottom, indicating weak selling pressure. This visual characteristic makes the Inverted Hammer easily recognizable on charts.
How reliable is the Inverted Hammer in technical analysis?
The reliability of the Inverted Hammer depends on several factors:
- Market context: The pattern is more effective when it appears at the end of a pronounced downtrend. If it forms after a significant price decline, it increases the likelihood of a reversal.
- Confirmation from subsequent candles: To enhance the reliability of the signal, it's important to wait for confirmation from the next candle. If a bullish candle (green) follows the Inverted Hammer, it strengthens the signal for a potential reversal.
- Trading volume: High volume during the formation of the Inverted Hammer indicates that many traders are recognizing the pattern, which adds confidence to the signal.
How often does the Inverted Hammer pattern occur?
The frequency of the Inverted Hammer can vary widely:
- Dependence on the asset: In some markets, such as stocks or forex, the pattern may appear more frequently, while in others, it may be less common.
- Time frames: The Inverted Hammer is more likely to occur on shorter time frames (like 15-minute or hourly charts) during downtrends. However, on longer time frames (daily or weekly charts), it may signal more significant changes in trend.
What does a red Inverted Hammer indicate?
A red Inverted Hammer indicates that buyers attempted to push the price higher but ultimately closed below the opening level, suggesting that sellers regained control. This can signal uncertainty in the market, where despite some buying interest, overall market sentiment remains bearish. Such a signal requires careful attention and may need confirmation from subsequent candles to understand whether prices will return to a downtrend.
What does a green Inverted Hammer tell us?
A green Inverted Hammer indicates that buyers not only attempted to push prices higher but succeeded in closing above the opening price. This reflects stronger bullish momentum and suggests that the downtrend may be losing strength, making it a more reliable signal for a potential reversal. Traders often view this pattern as an opportunity to enter long positions, especially if confirmed by subsequent bullish candles.
