Technical analysis is a vital tool in trading, allowing traders to evaluate market movements and make informed decisions based on historical price data. Among various techniques, chart patterns play a crucial role in predicting future price actions. One of the most recognized formations is the Head and Shoulders pattern, which serves as a key indicator for potential market reversals.
Head and Shoulders Pattern Definition
Description of the Pattern
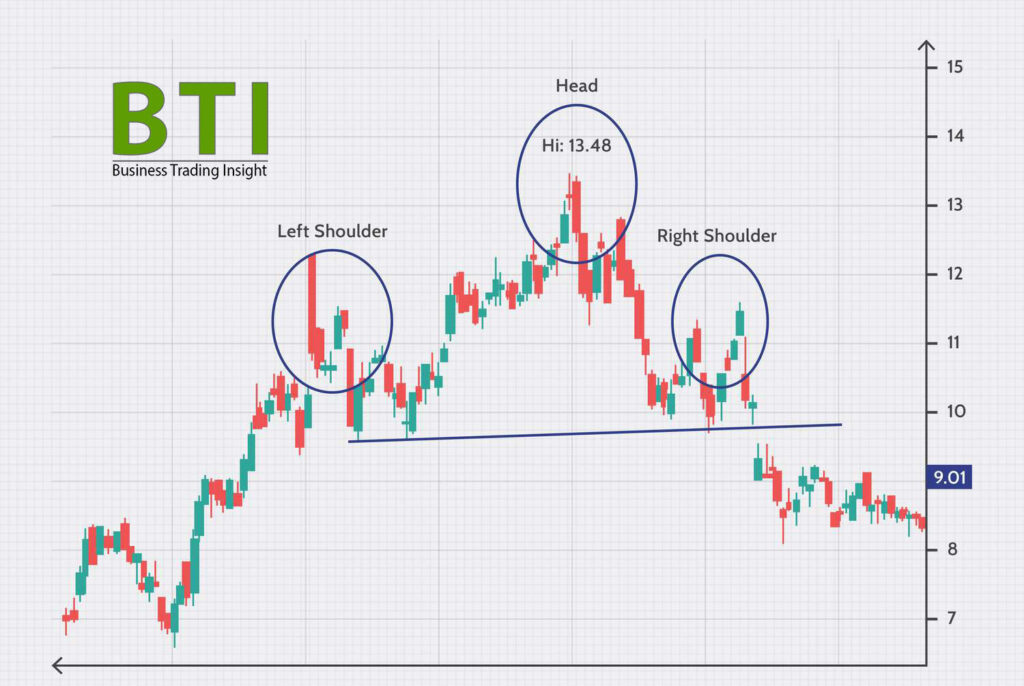
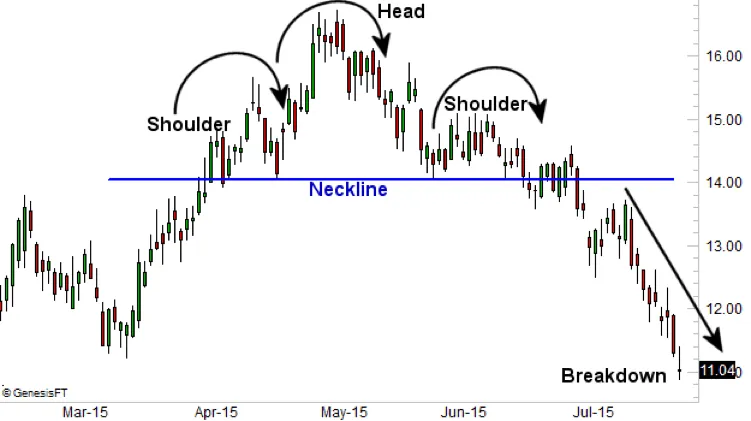
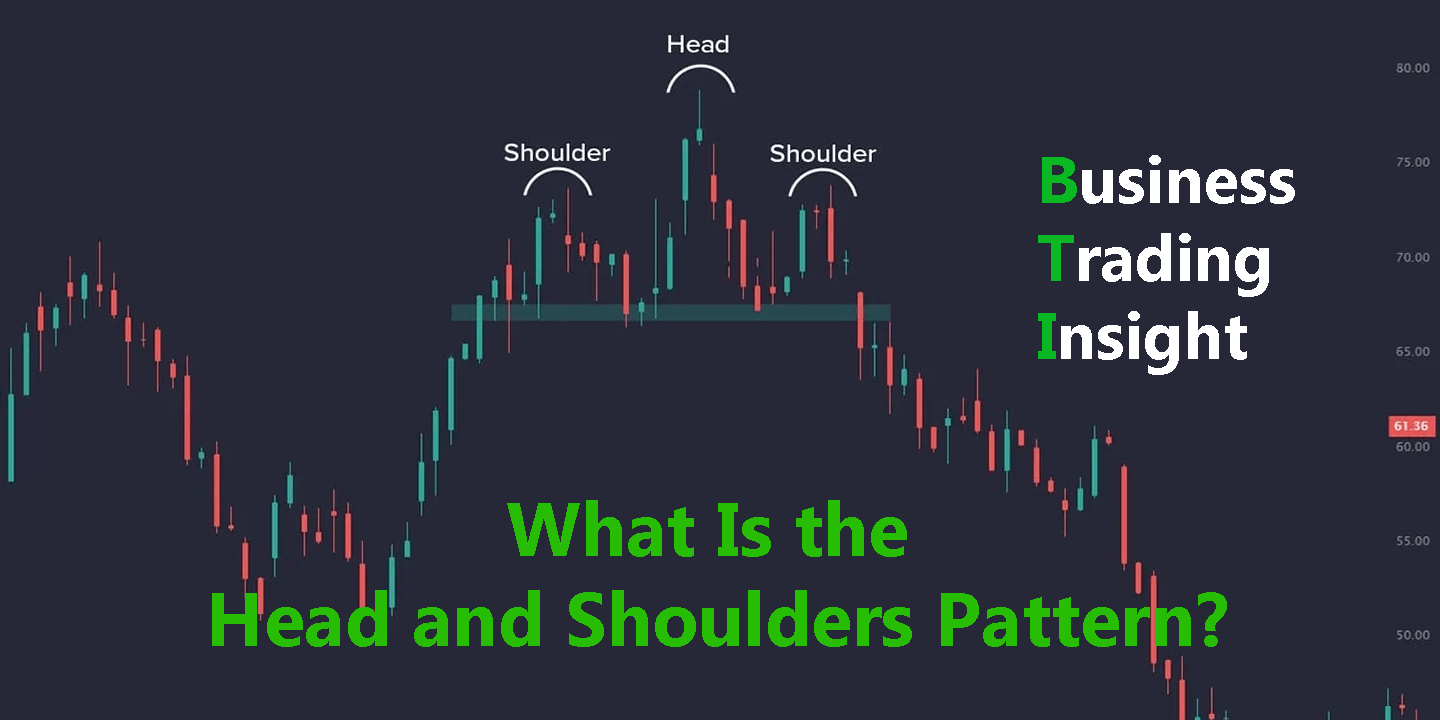
The Head and Shoulders pattern consists of three peaks: the left shoulder, the head, and the right shoulder. The left shoulder forms first, followed by the head, which is the highest peak, and finally the right shoulder, which resembles the left but is typically lower than the head. This formation indicates a potential reversal in the trend.
Formation Characteristics
Key features that define the Head and Shoulders pattern include:
- Price Movements: The price moves up to form the left shoulder, declines, rises again to create the head, and then declines before rising again to create the right shoulder.
- Volume Trends: Volume typically increases as the head is formed and may decrease as the pattern completes, indicating a weakening trend.
Market Context
The Head and Shoulders pattern usually appears in trending markets, particularly after an uptrend. Its presence suggests that the bullish momentum is fading and a bearish reversal may occur.
Inverse Head and Shoulders

Definition of Inverse Head and Shoulders
The Inverse Head and Shoulders pattern is the opposite of the standard formation. Instead of peaks, this pattern consists of troughs: the left shoulder, the head, and the right shoulder. It signifies a potential bullish reversal following a downtrend.
Formation Characteristics
The components of the Inverse Head and Shoulders pattern include:
- Left Shoulder: A decline followed by a recovery.
- Head: A deeper trough followed by a rally.
- Right Shoulder: A shallow trough similar to the left shoulder, indicating a potential upward move.
Market Context
This pattern typically emerges in bearish markets, suggesting that selling pressure is diminishing and a trend reversal to the upside may be imminent.
What Does the Head and Shoulders Pattern Tell You?

Market Sentiment Interpretation
The Head and Shoulders pattern is a clear indicator of trend reversals. When this formation appears, it signals that buyers are losing control, and sellers are likely to take over, which could lead to a price decline.
Signal Strength
The strength of the signal can vary based on the completeness of the pattern’s formation. A well-defined Head and Shoulders pattern with significant volume increase during the left shoulder and head formations is more likely to indicate a strong reversal.
Confirmation Indicators
Traders often use additional technical indicators to validate the Head and Shoulders pattern, including:
- Volume: An increase in volume during the formation of the head indicates stronger sentiment.
- Moving Averages: Crossovers of moving averages can further confirm potential trend reversals.
Trading the Head and Shoulders Pattern
Entry and Exit Points
To trade the Head and Shoulders pattern effectively, consider the following strategies:
- Entry Point: Enter a trade when the price breaks below the neckline, which is the horizontal line connecting the troughs.
- Exit Point: Set a target price based on the height of the pattern (the distance from the head to the neckline) subtracted from the breakout point.
Stop Loss Placement
It is prudent to place a stop-loss order above the right shoulder. This minimizes potential losses if the market does not move as anticipated.
Profit Targets
Realistic profit targets can be established by measuring the distance from the head to the neckline and projecting that distance down from the breakout point. This method helps traders set achievable goals based on the pattern’s characteristics.
Common Pitfalls

Misidentification of the Pattern
One of the major risks in trading the Head and Shoulders pattern is misidentifying it. Traders should ensure that the formation is complete before making any trading decisions.
Ignoring Market Context
Failing to consider overall market conditions can lead to poor trading outcomes. The Head and Shoulders pattern should be evaluated within the context of broader market trends and sentiment.
Overtrading
Traders may be tempted to trade frequently based on the Head and Shoulders pattern alone. This can lead to increased transaction costs and emotional trading decisions. It is essential to remain disciplined and avoid overtrading.
Advantages and Disadvantages of the Head and Shoulders Pattern
| Advantages | Disadvantages |
|---|---|
| Predictive Power: Reliable indicator of trend reversals, allowing traders to anticipate market movements. | False Signals: In volatile markets, the pattern may produce false signals, leading to unexpected losses. |
| Clear Signals: Provides clear entry and exit points, simplifying decision-making. | Reliance on the Pattern: Over-relying on this pattern without considering other indicators may result in missed opportunities or losses. |
The Head and Shoulders pattern is a significant tool in technical analysis that can signal potential market reversals. By understanding its formation, characteristics, and trading implications, traders can make informed decisions to improve their trading strategies.
Combining the Head and Shoulders pattern with other technical analysis tools enhances trading effectiveness. Staying aware of market conditions and maintaining a disciplined approach will lead to better decision-making and improved trading outcomes.


