Candlestick patterns are essential tools in technical analysis, providing traders with visual insights into market sentiment and potential price movements. Among these patterns, the Three Black Crows pattern stands out as a significant bearish indicator. This article explores the intricacies of the Three Black Crows pattern, its implications for traders, and strategies for effectively incorporating it into trading decisions.
What is the Significance of Three Black Crows Candlestick Patterns?
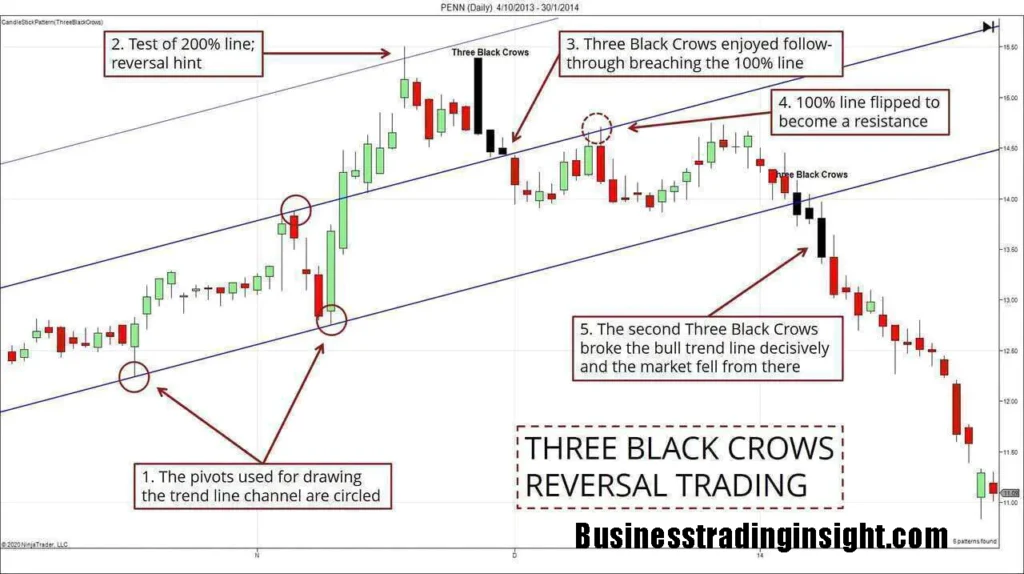
The Three Black Crows pattern consists of three consecutive bearish candles that signal a potential reversal in a prevailing uptrend. This pattern is vital in understanding market psychology, as it indicates a shift in sentiment from bullish to bearish. Each black candle reflects increasing selling pressure, showcasing that buyers are losing control.
Market Sentiment and Trend Reversal Implications
- Market Sentiment: The appearance of the Three Black Crows pattern suggests that sellers are gaining dominance. This shift can lead to heightened fear among investors, often prompting further selling.
- Trend Reversal: As the pattern unfolds, it often signals a broader trend reversal. Traders must be vigilant, as this pattern can herald significant price declines in the subsequent sessions.
Is a Three Black Crows a Triple Candlestick Pattern?
Yes, the Three Black Crows is classified as a triple candlestick pattern.
Definition of Triple Candlestick Patterns
Triple candlestick patterns involve three distinct candles that collectively signify a change in market sentiment. These patterns can indicate continuation or reversal of trends, depending on the arrangement of the candles.
How Three Black Crows Fits into This Category
The Three Black Crows pattern specifically fits into the reversal category. It serves as a warning signal for traders, suggesting that an uptrend may be coming to an end.
Comparison with Other Common Triple Candlestick Patterns
- Three White Soldiers: A bullish counterpart to the Three Black Crows, consisting of three consecutive bullish candles. It indicates strength and continuation of an uptrend.
- Evening Star: Another bearish pattern that involves three candles but includes a gap, signaling an impending downtrend after an uptrend.

How Are the Three Black Crows Candlestick Pattern Structured?
The Three Black Crows pattern is structured in a specific way:
Definition of the Three Consecutive Black (Bearish) Candles
- First Candle: A bearish candle that closes lower than its open, indicating initial selling pressure.
- Second Candle: Another bearish candle that opens within the body of the first but closes lower, demonstrating continued selling.
- Third Candle: A third bearish candle that opens within the body of the second, again closing lower, reinforcing the downtrend.
Criteria for Each Candle
- Open: Each successive candle opens within the body of the preceding candle.
- Close: Each candle closes lower than the previous candle’s close.
- High: Each candle’s high should ideally be lower than the high of the previous candle.
- Low: Each candle’s low must progress downward, confirming selling momentum.
Visual Representation of the Pattern
A visual representation of the Three Black Crows pattern typically displays three black candles, with each subsequent candle closing lower than the last, creating a steep downward slope. This visualization is crucial for traders to identify the pattern quickly.
When do Three Black Crows Candlestick Patterns Occur?
The occurrence of the Three Black Crows pattern is often linked to specific market conditions.
Market Conditions for the Pattern
The pattern usually appears after a sustained uptrend. It indicates that the previous bullish sentiment is weakening and that sellers are stepping in aggressively.
Preceding Trend and Context
- Prior Uptrend: The Three Black Crows pattern emerges after a strong uptrend, serving as a cautionary signal that market dynamics are shifting.
- Volume Considerations: Increased trading volume during the formation of the Three Black Crows pattern can reinforce its significance, indicating strong selling pressure.
What are the Criteria for Recognizing the Three Black Crows Candlestick Pattern in Technical Analysis?
To effectively identify the Three Black Crows pattern, traders should look for specific criteria:
Candle Color and Body Size:
- Each of the three candles should be black (bearish) with relatively large bodies.
- Smaller wicks may suggest stronger bearish momentum.
Position Relative to Previous Candles:
- Each candle must open within the body of the previous candle.
- The sequence must visually illustrate a downward progression.
Volume Considerations:
- Confirming volume should increase as the pattern develops, indicating strong selling interest.
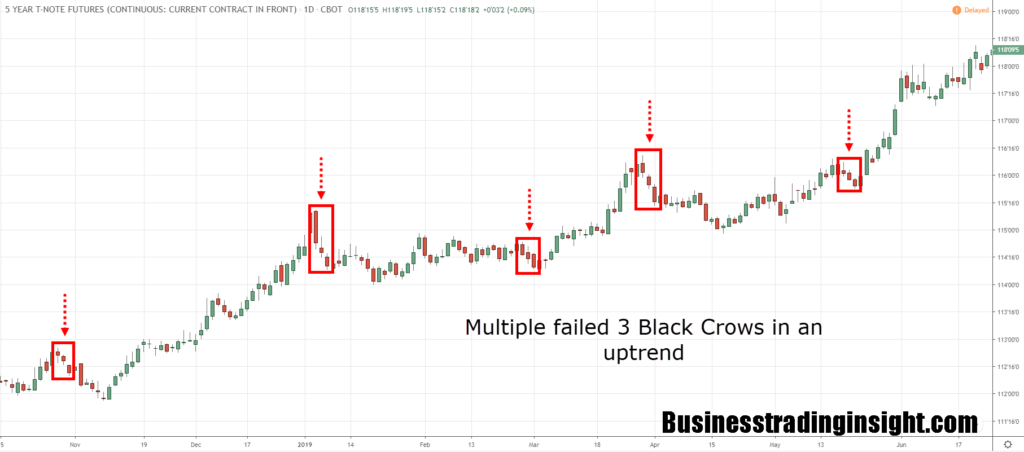
- A lack of volume can undermine the reliability of the pattern.
Importance of Confirmation Signals:
- Traders should look for additional confirmation signals, such as bearish indicators or patterns following the Three Black Crows, to enhance trade reliability.

How to Trade Using Three Black Crows Candlestick in the Stock Market?
Trading the Three Black Crows pattern effectively requires a well-defined strategy:
Trading Strategies Based on the Three Black Crows Pattern
Entry Points:
- Consider entering a short position after the formation of the third black candle, especially if confirmed by subsequent bearish signals.
Stop-Loss Placement:
- A prudent stop-loss can be placed above the high of the third candle, protecting against unexpected upward moves.
Target Setting:
- Determine profit targets based on recent support levels or Fibonacci retracement levels to identify potential reversal points.
Risk Management Techniques
- Position Sizing: Use proper position sizing to manage risk relative to your overall capital.
- Diversification: Avoid concentrating all trades on one asset, as this can increase risk.
Example of How to Use Three Black Crows
Consider a real-world example to illustrate the use of the Three Black Crows pattern:
Step-by-Step Analysis
- Identifying the Pattern: After a prolonged uptrend in stock XYZ, three consecutive black candles emerge, each closing lower than the last.
- Volume Confirmation: Observing increased volume on each of the bearish candles suggests strong selling.
- Entering the Trade: A trader decides to enter a short position after the third candle, placing a stop-loss above its high.
- Trade Outcome: As the market continues to decline, the trader realizes profits by closing the position at a predetermined support level.

Three Black Crows vs. Three White Soldiers
Understanding the Three Black Crows pattern becomes more insightful when comparing it to the Three White Soldiers pattern.
Definition of Three White Soldiers
The Three White Soldiers pattern consists of three consecutive bullish candles that signal a potential reversal from a bearish trend to a bullish trend.
Key Differences and Similarities
- Market Sentiment: Three Black Crows reflects bearish sentiment, while Three White Soldiers reflects bullish sentiment.
- Formation: Both patterns consist of three candles but are used in different market contexts for trading decisions.
Situational Use of Each Pattern in Trading Strategies
- Three Black Crows: Best utilized in a bearish market context following an uptrend, indicating strong selling pressure.
- Three White Soldiers: Effective in bullish contexts after a downtrend, signaling a shift toward buyer dominance.
Summary of the Importance of the Three Black Crows Pattern in Trading
The Three Black Crows pattern serves as a crucial tool for traders seeking to identify potential market reversals. Its ability to highlight bearish sentiment can aid in making informed trading decisions, particularly in conjunction with other technical indicators. By effectively integrating this pattern into a broader trading strategy, traders can enhance their market analysis and improve their trading outcomes.
Final Thoughts on Integration into Trading Strategy
Traders are encouraged to incorporate the Three Black Crows pattern alongside other technical analysis tools to increase the likelihood of successful trades. With careful observation and robust risk management practices, this pattern can become an integral part of a trader’s arsenal, guiding them through the complexities of market movements.


