Candlestick patterns are essential tools for traders, providing visual insights into market sentiment and potential price movements. Among these patterns, the hanging man candlestick stands out due to its unique characteristics and significance. Understanding this pattern is crucial for traders looking to identify potential market reversals and make informed trading decisions. In this article, we will explore the hanging man candlestick pattern in detail, its psychology, how to interpret it, and its practical applications in trading.
Definition of the Hanging Man Pattern
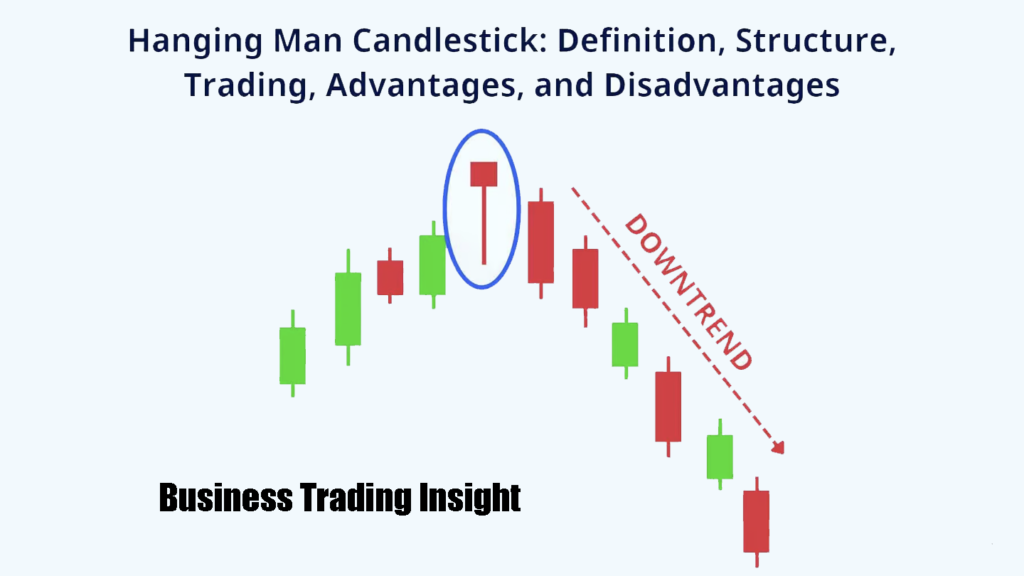
The hanging man candlestick is a bearish reversal pattern that typically appears at the top of an uptrend. It consists of a single candlestick that has a small body, a long lower shadow, and little to no upper shadow. This structure suggests that sellers have begun to exert control over the market after a bullish phase.

Formation and Characteristics
To recognize a hanging man candlestick, traders should look for the following characteristics:
- Small Body: The body of the candle should be near the top of the price range.
- Long Lower Shadow: The lower shadow should be at least twice the length of the body.
- Little to No Upper Shadow: A negligible upper shadow reinforces the idea of selling pressure.
The following table summarizes the characteristics of the hanging man pattern compared to other common candlestick patterns:
| Feature | Hanging Man | Hammer | Shooting Star |
| Trend Context | Uptrend | Downtrend | Uptrend |
| Body Size | Small | Small | Small |
| Lower Shadow Length | Long (at least 2x) | Long (at least 2x) | Short |
| Upper Shadow Length | Short or none | Short or none | Long |
| Implication | Bearish reversal | Bullish reversal | Bearish reversal |
Comparison with Other Candlestick Patterns
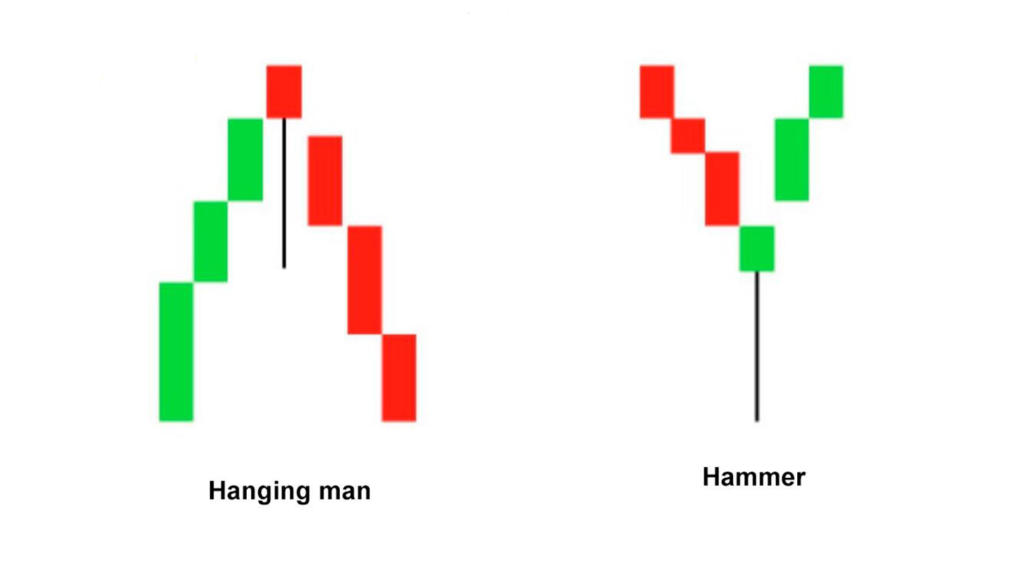
While the hanging man shares similarities with the hammer and shooting star patterns, it is essential to note the context in which each occurs. The hanging man appears after a bullish trend, signaling potential weakness, whereas the hammer appears during a downtrend, indicating a possible reversal to the upside. The shooting star, on the other hand, appears in an uptrend and signals a potential bearish reversal, similar to the hanging man.
Psychology of the Hanging Man Pattern
The psychology behind the hanging man candlestick pattern is rooted in the struggle between buyers and sellers. During its formation, buyers initially push the price higher, reflecting bullish sentiment. However, as the session progresses, sellers enter the market, driving the price down and creating a long lower shadow. This indicates a loss of momentum among buyers and suggests that sellers are gaining strength.
Role of Buyers and Sellers
In the context of the hanging man pattern, buyers represent the initial enthusiasm in the market. However, as the price reaches a peak, sellers begin to dominate, leading to a significant pullback. This dynamic shift in power is what makes the hanging man a critical indicator of potential market reversals.
Implications for Market Reversals
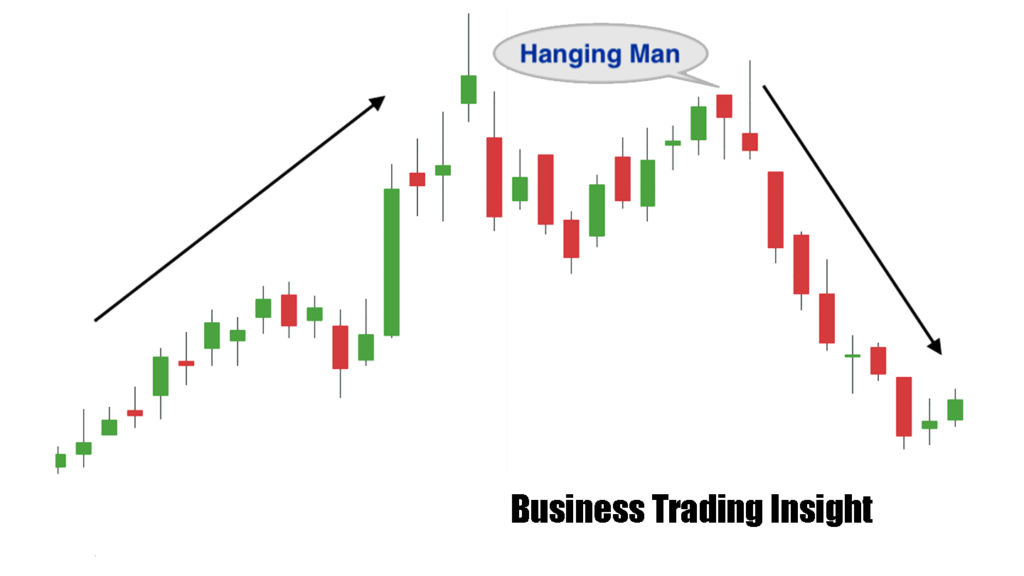
The appearance of the hanging man candlestick often signals that the bullish trend may be losing steam. While it does not guarantee a reversal, it serves as a warning sign for traders to be cautious and consider potential selling opportunities.

Interpreting the Hanging Man Pattern
Key Elements to Look For
To effectively interpret the hanging man candlestick, traders should consider the following elements:
- Location: The hanging man must appear at the top of an uptrend for it to be considered a valid reversal signal.
- Context: Analyze the preceding price action and overall market sentiment.
- Volume: A significant increase in volume during the formation of the hanging man can enhance its reliability.
Significance of the Previous Trend
The hanging man pattern is most potent when it appears after a sustained bullish trend. If it follows a series of strong bullish candles, traders can infer that a shift in market sentiment may be occurring.
Confirming the Pattern with Additional Indicators
To increase the reliability of the hanging man pattern, traders should consider using additional technical indicators. For instance, combining the hanging man with momentum indicators like the Relative Strength Index (RSI) or moving averages can help confirm the reversal signal and improve trading decisions.
Definition and Characteristics of Spinning Tops
A spinning top is another candlestick pattern characterized by a small body and long upper and lower shadows. This pattern signifies indecision in the market, with neither buyers nor sellers able to gain control.
Comparison with the Hanging Man Pattern
While both the spinning top and the hanging man candlestick indicate potential reversals, they convey different market sentiments. The hanging man indicates increasing selling pressure after a bullish trend, while the spinning top suggests a lack of direction and potential volatility.
Situations Where Spinning Tops Might Be More Relevant
Traders should look for spinning tops during periods of consolidation or when market uncertainty is high. These patterns can signal potential breakouts or breakdowns, making them valuable in different trading contexts compared to the hanging man pattern.

Trading the Hanging Man Pattern
Strategies for Entering and Exiting Trades
When trading the hanging man candlestick, traders typically look for confirmation before entering a position. A common strategy is to wait for the next candle to close below the low of the hanging man, indicating that selling pressure is indeed increasing.
Example Entry Strategy:
- Entry: Enter a short position when the price breaks below the hanging man’s low.
- Take-Profit: Set a take-profit target based on previous support levels.
Risk Management Techniques
Effective risk management is crucial when trading the hanging man pattern. Here are some techniques:
- Stop-Loss Placement: Place stop-loss orders above the high of the hanging man to limit potential losses.
- Position Sizing: Adjust the size of your position based on the volatility of the asset and your overall risk tolerance.
Examples of Successful Trades Using the Hanging Man Pattern
Consider a hypothetical example where a trader identifies a hanging man at the top of an uptrend. After confirming the pattern with increased volume and a subsequent bearish candle, the trader enters a short position. By employing sound risk management techniques, they can capitalize on the potential downward move while protecting their capital.

Limitations of the Hanging Man Pattern
Potential Pitfalls and False Signals
Despite its significance, the hanging man candlestick pattern is not foolproof. Traders should be cautious of false signals, where the price continues to rise despite the formation of a hanging man. This can occur in strong bullish trends where buyers remain in control.
Importance of Using Additional Analysis and Indicators
To mitigate the risk of false signals, it is essential to incorporate additional analysis. Combining the hanging man pattern with trend indicators, oscillators, or volume analysis can enhance the probability of a successful trade.
Situations Where the Pattern May Not Be Reliable
The hanging man pattern may be less reliable in low-volume markets or during significant news events. In such cases, price action can be erratic, leading to potential misinterpretation of the pattern.
Hanging Man vs. Shooting Star vs. Hammer
- Hanging Man: Appears in an uptrend, indicating potential bearish reversal.
- Shooting Star: Forms after a bullish move, suggesting that buyers are losing control and sellers may take over.
- Hammer: Appears in a downtrend, indicating a potential bullish reversal, characterized by a small body and a long lower shadow.
Key Differences and Similarities
While all three patterns indicate potential reversals, their context and implications differ. The hanging man and shooting star signal bearish reversals, whereas the hammer indicates a bullish reversal. Understanding these differences is vital for traders aiming to capitalize on market movements.
Context in Which Each Pattern Is Most Effective
Traders should utilize the hanging man pattern primarily in trending markets, where it can signify a shift in momentum. The shooting star is effective after strong uptrends, while the hammer is most valuable in downtrends, providing clarity on market reversals.
The hanging man candlestick pattern is a powerful tool for traders seeking to identify potential market reversals. By understanding its formation, psychology, and how to interpret it, traders can enhance their decision-making processes. While the hanging man pattern is a valuable indicator, it is essential to incorporate additional analysis and risk management techniques to improve trading success.
As you practice analyzing candlestick patterns, consider using the hanging man in your trading strategy and monitor its effectiveness in live markets. Engaging with these concepts can lead to more informed and confident trading decisions. Happy trading!


