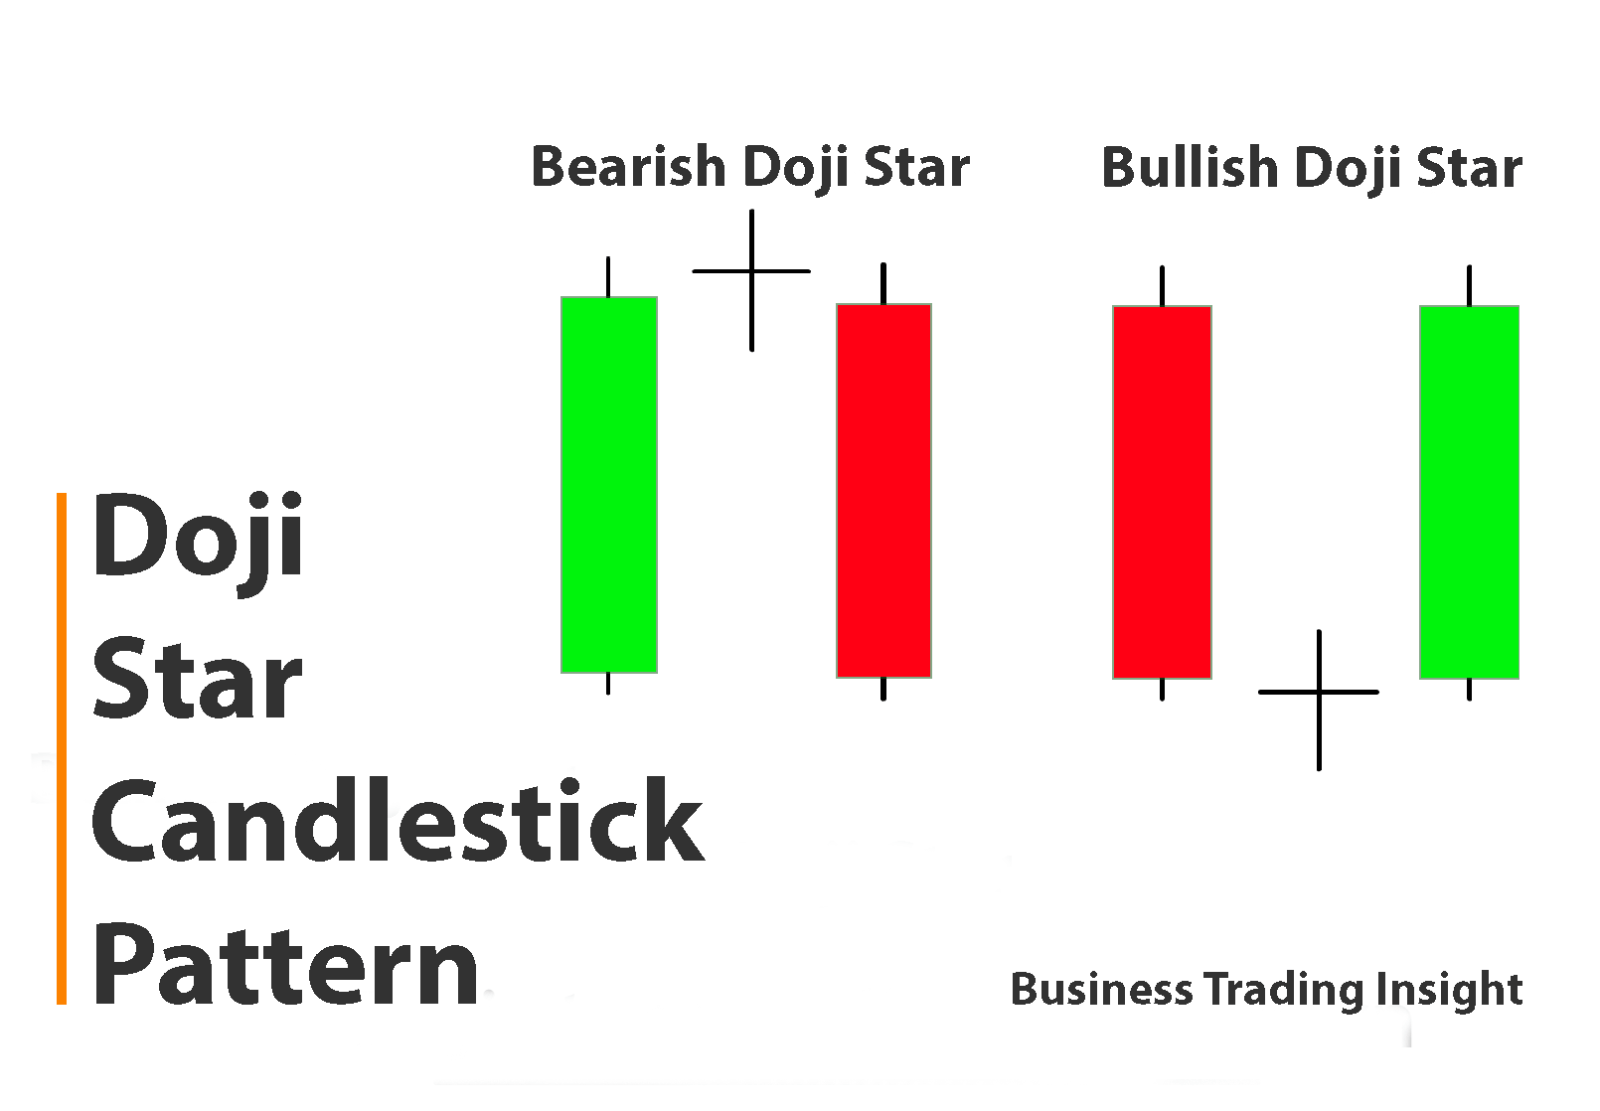
The Evening Doji Star is one of the most widely recognized and powerful candlestick patterns used by traders to predict trend reversals, especially from a bullish (upward) trend to a bearish (downward) one. It is a crucial tool in technical analysis, particularly when traders are looking for signs of market shifts after a strong price movement. This guide will explain what the Evening Doji Star is, how to recognize it, and provide practical strategies for incorporating it into your trading system.
What is the Evening Doji Star Pattern?
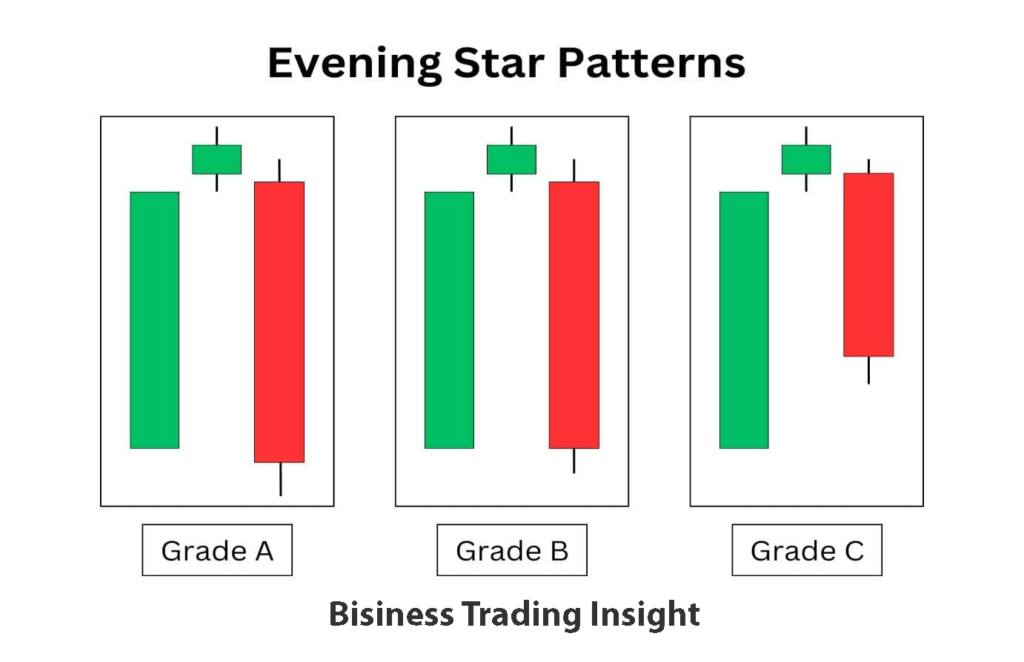
The Evening Doji Star is a three-candle pattern that typically appears at the peak of an uptrend, signaling a possible reversal from an upward trend to a downward one. The pattern consists of three specific candles:
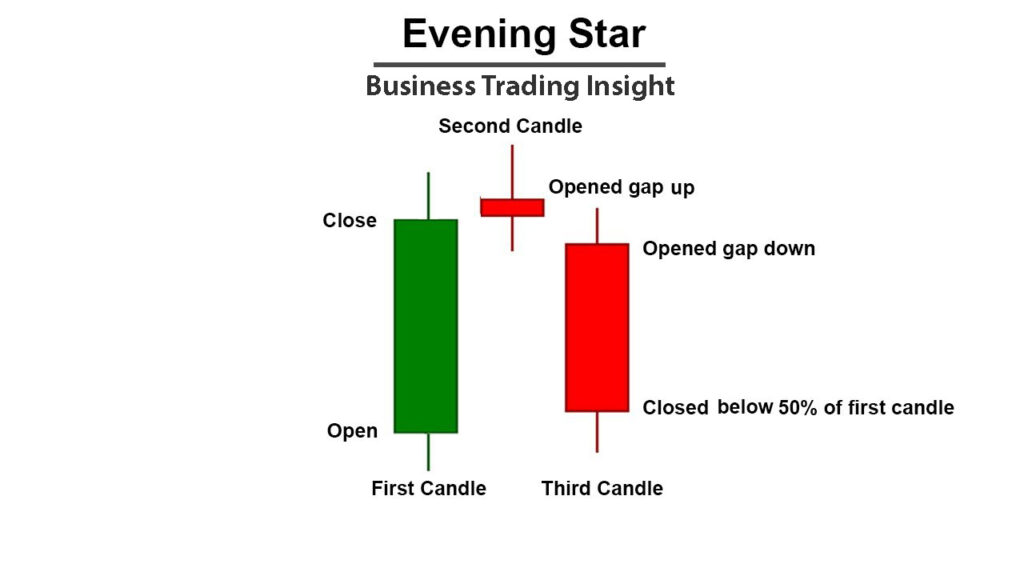
- First Candle (Bullish): A long bullish (green or white) candle that indicates strong upward momentum.
- Second Candle (Doji): A Doji candle, characterized by a very small body where the opening and closing prices are nearly the same, indicating market indecision.
- Third Candle (Bearish): A long bearish (red or black) candle that closes lower than the low of the first bullish candle, confirming the shift from bullish to bearish sentiment.
The significance of this pattern lies in the fact that it suggests the bulls have exhausted their strength, and the bears are beginning to take control, potentially signaling a market reversal.
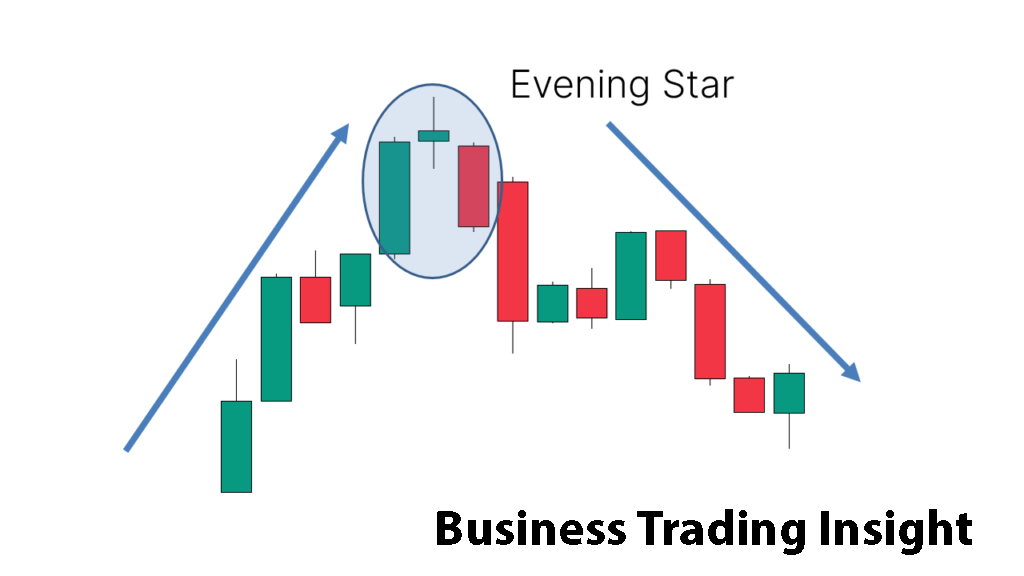
Understanding the Three Candles
Let’s break down the three candles in detail:
- The First Bullish Candle: This is a long candle that indicates a strong uptrend. It should have a large body and close near its high, showing that buyers are in control and pushing prices higher.
- The Doji Candle: The second candle is the Doji, which has a very small body. It suggests indecision in the market, where neither the bulls nor the bears are able to establish dominance. The Doji is often seen as a «pause» in the market, signaling that the buying momentum from the first candle is beginning to fade.
- The Bearish Candle: The third and final candle is a long bearish candle that closes lower than the low of the first bullish candle. This confirms the market sentiment has shifted from bullish to bearish, and the trend may be reversing. The larger the bearish candle, the stronger the reversal signal.
Why is it Called the «Evening Doji Star»?
The pattern is named «Evening Doji Star» because it visually resembles a sunset. The first bullish candle represents the sun at its highest point, the Doji marks the moment when the sun begins to set (indicating a pause in momentum), and the third bearish candle represents the sunset itself, signaling the end of the uptrend and the potential start of a downtrend.
How to Recognize the Evening Doji Star on a Chart
Recognizing the Evening Doji Star on a chart is essential for traders looking to capitalize on potential reversals. While the pattern itself is straightforward, the key to successful trading lies in identifying the pattern in the correct market context.
Key Visual Signs:
- First Bullish Candle: Look for a long bullish candle, typically with a large body, closing near its high. This confirms that the market is in a strong uptrend.
- Doji Candle: The second candle should be a Doji, with a small body, showing indecision. Its small size indicates that the buying pressure from the first candle is weakening, and the market is uncertain about its next move.
- Bearish Candle: The third candle is the most important. It should be a long bearish candle that closes below the low of the first candle. This confirms that sellers are in control and a reversal is likely underway.
Where to Look for the Pattern
The Evening Doji Star is most reliable when it appears at the peak of an uptrend or near a significant resistance level. If it forms in a downtrend or in a choppy, sideways market, it may not be as reliable. The pattern becomes stronger when it follows a period of strong price movement upwards, signaling that the bulls are running out of steam.
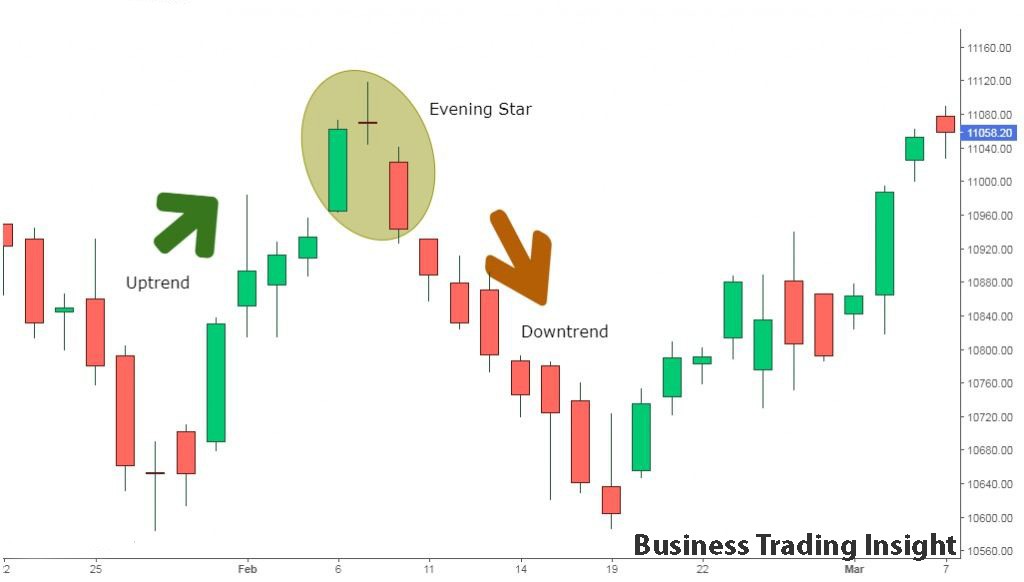
How to Use the Evening Doji Star in Trading
To use the Evening Doji Star effectively, you need to understand when to enter a trade, where to set stop-loss levels, and how to manage your risk. While the pattern is a strong indicator of a potential reversal, it’s crucial to confirm the signal before acting on it.
Entry Points
The best time to enter a trade is after the third candle has completed and the price has moved below the low of the third candle. This confirms that the reversal is underway, and entering the trade at this point reduces the chances of acting on a false signal.
Example of a Short Entry:
- Look for the Doji to form after a strong uptrend.
- Wait for the third bearish candle to close below the first candle’s close.
- Once confirmed, enter a short position.
By waiting for confirmation, you ensure that the price has already started to reverse, avoiding premature entry at the top of the trend.
Stop-Loss Levels
To protect your position, place your stop-loss just above the high of the first bullish candle. This way, if the price continues upward, you will exit the trade before incurring significant losses.
Exit Strategies
Once your trade is active, you should have a clear exit strategy. Common strategies include:
- Support Levels: Set your target at key support levels where the price has previously reversed.
- Fibonacci Retracement Levels: Use Fibonacci retracement levels to identify potential areas where the price may reverse or pull back before continuing its downtrend.
- Trailing Stop-Loss: As the price moves in your favor, use a trailing stop-loss to lock in profits while still giving the trade room to move.
Risk Management and Capital Allocation
While the Evening Doji Star is a strong pattern, it’s essential to apply proper risk management to avoid large losses.
- Position Size: The size of your position should depend on your stop-loss level and the volatility of the asset you’re trading. For instance, if you are trading on a more volatile asset like Bitcoin, you may want to reduce your position size to account for larger price swings.
- Risk-Reward Ratio: Aim for a risk-reward ratio of at least 1:2. This means that for every dollar you risk, you should aim to make two dollars in profit. If your stop-loss is 50 pips, your target should be at least 100 pips.
- Diversification: Don’t put all your capital into one trade. Spread your risk across different trades or asset classes to reduce the impact of a potential loss.
Confirming the Signal with Other Indicators
No candlestick pattern is foolproof, and false signals can occur. To improve the reliability of the Evening Doji Star, confirm the signal with other technical indicators:
- RSI (Relative Strength Index): An RSI above 70 (overbought) strengthens the case for a bearish reversal, while an RSI below 30 (oversold) may weaken the reversal signal.
- MACD (Moving Average Convergence Divergence): A bearish MACD crossover (when the MACD line crosses below the signal line) is a strong confirmation of bearish momentum.
- Volume: High volume during the third bearish candle adds credibility to the pattern. It suggests the reversal is backed by strong selling pressure.
The Importance of Timeframes in Using the Evening Doji Star
The timeframe you use can significantly impact the reliability of the Evening Doji Star pattern. Generally, this pattern is more effective on higher timeframes but can still provide valuable signals on shorter timeframes when used with caution.
Best Timeframes for Evening Doji Star
- Higher Timeframes (Daily and Weekly): The Evening Doji Star is more reliable on daily and weekly charts. These timeframes represent a larger market cycle and provide a more complete picture of market sentiment.
- Lower Timeframes (Hourly and 4-Hour): The pattern can appear on shorter timeframes, but it tends to be less reliable due to market noise. For day traders, it’s crucial to confirm the signal with other indicators like RSI, MACD, or volume to avoid false breakouts.
Timeframe Strategies
- Swing Trading: On daily charts, the Evening Doji Star is a powerful signal for trend reversals. Swing traders can take advantage of the reversal over several days or weeks.
- Day Trading: On shorter timeframes (such as 1-hour or 4-hour charts), the pattern can still be useful, but traders must be more cautious. Confirm the signal with additional indicators to avoid acting on false signals.
Real Trade Examples
Example 1: EUR/USD on the Daily Chart
On the daily chart, EUR/USD formed an Evening Doji Star after a strong uptrend. The first bullish candle was large, followed by a Doji, and then a long bearish candle. The price dropped significantly after the pattern was confirmed, providing a profitable short opportunity.
Example 2: Bitcoin During High Volatility
During a period of high volatility, Bitcoin formed an Evening Doji Star on a 4-hour chart. The MACD had just crossed below the signal line, and the RSI was moving from overbought levels, confirming the bearish shift. Traders who entered short were able to capture a significant downward move.
Conclusion
The Evening Doji Star is a potent candlestick pattern that can help traders spot trend reversals in the market. By understanding the key components of the pattern and how to interpret it, traders can use it as part of a robust trading strategy. Combining the Evening Doji Star with other technical indicators, such as RSI, MACD, and volume, improves the reliability of the pattern and minimizes the risk of false signals.
Remember to use the Evening Doji Star in the right context (after a strong uptrend) and always confirm the pattern with other technical tools. Whether you are a swing trader or a day trader, mastering this pattern can give you a significant edge in predicting trend reversals and making better-informed trading decisions.
FAQ
On which timeframes is the Evening Doji Star pattern most reliable?
The Evening Doji Star pattern is most reliable on daily (D1) and weekly (W1) charts, as these timeframes reflect larger market cycles and provide more accurate signals for trend reversals. However, it can also be used on shorter timeframes, such as the 1-hour or 4-hour charts, if confirmed by other technical indicators like RSI or MACD. On shorter timeframes, traders should be more cautious due to the potential for false signals.
How to use the Evening Doji Star in trading?
To use the Evening Doji Star in trading, it’s recommended to:
- Enter the trade: Wait for the completion of the third bearish candle and for the price to fall below the low of that candle. This confirms that the trend has reversed.
- Entry example: After the third bearish candle forms, if the price drops below its low, it signals an opportunity to open a short position (sell).
- Exit strategy: Set your targets at key support levels, Fibonacci retracement levels, or use a trailing stop to lock in profits as the price continues to move in your favor.
This approach helps avoid premature entry and reduces the likelihood of false signals.
What stop-loss levels should be set when using the Evening Doji Star pattern?
When using the Evening Doji Star pattern for risk management, it’s important to place the stop-loss just above the high of the first bullish candle. This is because if the price continues moving upward, your stop-loss will allow you to exit the trade with minimal losses, limiting potential damage. This level is key, as if the bulls manage to break the high of the first candle, it may indicate that the trend is not reversing, and the pattern may be a false signal.
What is the role of the Doji candle in the Evening Doji Star pattern?
The Doji candle plays a critical role in marking market indecision. With a small body, the Doji indicates that the opening and closing prices are nearly the same, reflecting a balance between buyers and sellers. This suggests that neither side is able to assert dominance. The appearance of the Doji after a strong upward movement signals that buying pressure is weakening, and the market is in a pause phase. This moment often precedes a trend reversal, making the Doji candle an important indicator for traders anticipating a shift from bullish to bearish sentiment.
