Camarilla Pivot Points are a key tool for traders looking to make informed decisions in volatile markets. This method offers unique insight into potential price reversals and breakout points, providing a roadmap for trading decisions. In this article, we’ll explore the origins, calculation, and practical use of Camarilla Pivot Points in trading, as well as their advantages and drawbacks.
What Are Pivot Points and Why Do Traders Use Camarilla Pivot Points?
Pivot points are technical analysis indicators that help traders identify key levels where the price of a security may reverse or break out. These levels act as a guide to understanding the market’s potential direction. In simple terms, pivot points represent a central price level from which the price may pivot — either reversing or continuing in the current direction.
Camarilla Pivot Points are one of several methods used to calculate these key levels, and they stand out for their focus on intraday price movements. Traders use Camarilla-based pivot levels to predict potential turning points, breakouts, and reversals, making them essential in short-term trading strategies.
The Camarilla method was developed by trader Nick Stott in the 1990s and has since become one of the most widely used techniques for calculating pivot points. Compared to standard pivot points or Fibonacci pivot levels, Camarilla Pivot Points are often considered more accurate, particularly in volatile or fast-moving markets.
In this article, we will dive deeper into the mechanics of Camarilla pivot points and how traders can apply them effectively in their strategies.
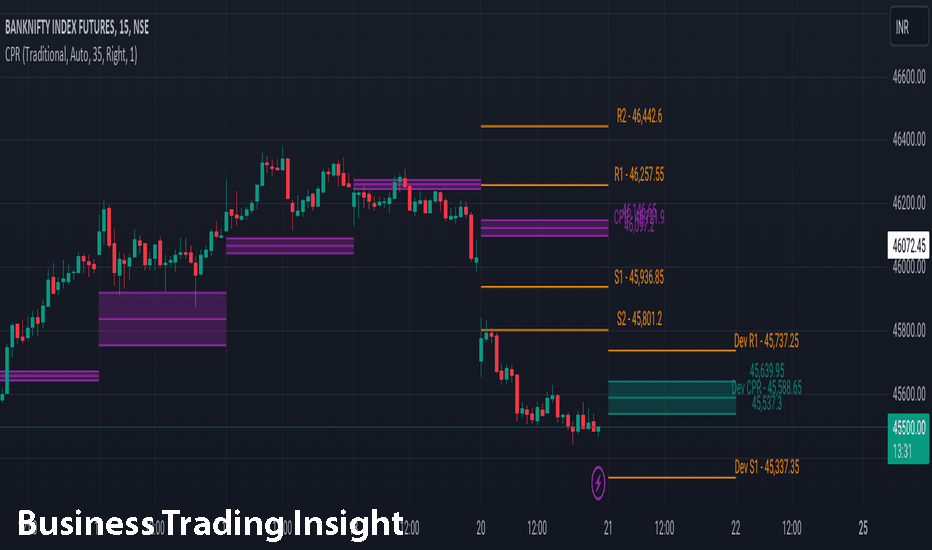
History of Camarilla Pivot Points
The Camarilla method was developed by Nick Stott in the early 1990s, drawing inspiration from the classical pivot point theory. Stott’s goal was to create a more refined version of traditional pivot points that could provide more accurate levels for intraday trading. By factoring in both historical price data and the market’s volatility, the Camarilla system introduced a set of key levels that traders could use to pinpoint potential turning points and price reversals.
Over the years, the Camarilla method gained popularity due to its precision and effectiveness in volatile markets. Many traders found that it provided clearer signals compared to other pivot point systems, such as standard pivots or Fibonacci levels. Today, Camarilla Pivot Points are widely used by day traders, swing traders, and even institutional traders who are looking for an edge in highly liquid markets.
The primary advantage of Camarilla Pivot Points lies in their ability to account for both support and resistance levels based on the day’s trading range. This makes them especially valuable for short-term traders who rely on timely, accurate price action signals.
Key Components of Camarilla Pivot Points
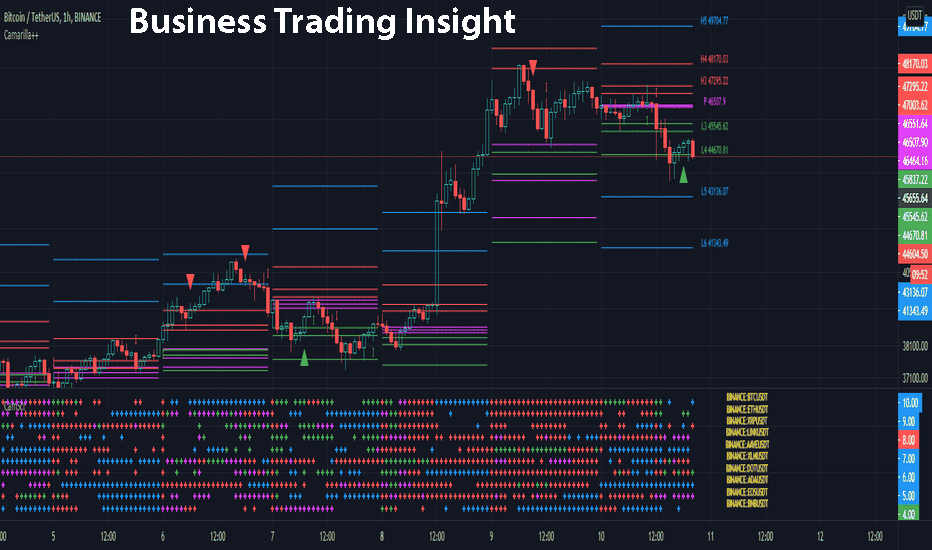
Camarilla Pivot Points consist of several key levels that are used to determine potential price reversal points throughout the day. These levels are calculated based on the previous day’s high, low, and close prices, and they are divided into multiple resistance and support zones.
Key Levels
- H3, H4 — Resistance Levels
These are the upper levels where the price may encounter resistance and reverse. They help traders identify potential points where the price could «bounce» back downward. - L3, L4 — Support Levels
These are the lower levels where the price could find support and reverse upwards. Traders look for price action signals near these levels to initiate long positions. - Pivots (The Main Level)
The pivot point (P) is the central level that acts as a baseline for calculating the support and resistance levels. It is the most significant level and serves as the first point of reference for determining market sentiment.
Formulas for Calculating Camarilla Pivot Points
The calculation for Camarilla levels is relatively straightforward. Here is the step-by-step process for calculating each level:
Calculate the range (R):
R = High − Low
Find the pivot (P):
P = ( High + Low + Close ) / 3
Calculate the resistance and support levels:
H3 = P + ( R × 1.1 ) H4 = P + ( R \ times 1.5 )
L3 = P — ( R × 1.1 ) L4 = P — (R \times 1.5)
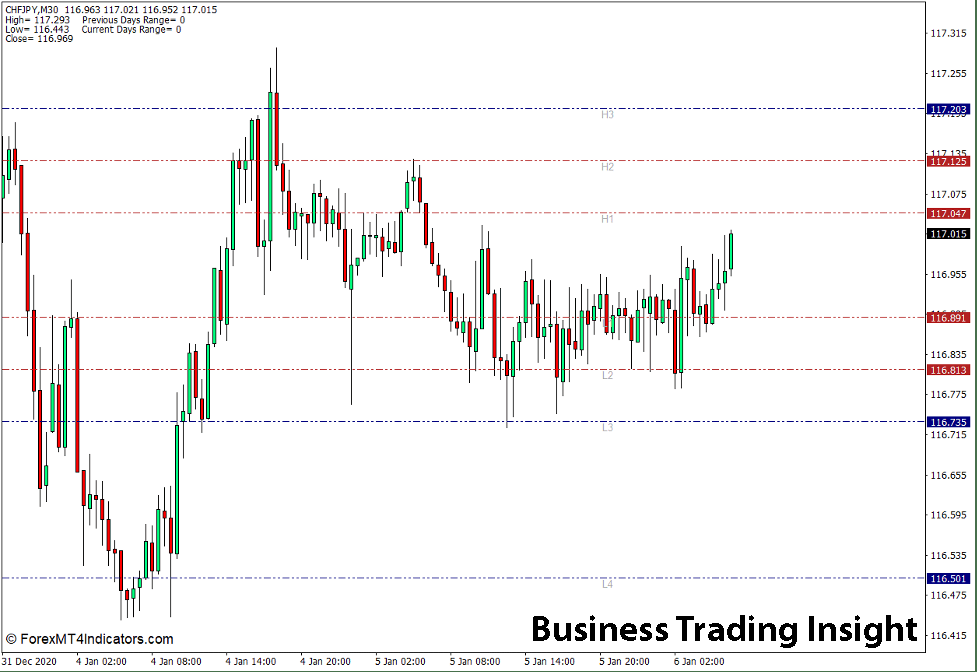
These calculations give you the key levels (H3, H4, L3, L4) that traders can monitor throughout the trading day. Visualizing these levels on a price chart can help traders spot potential turning points and price reversals based on the Camarilla technique.
How to Use Camarilla Pivot Points in Trading
Traders use Camarilla Pivot Points to make decisions about when to enter or exit trades. The primary strategy involves buying near support levels (L3, L4) and selling near resistance levels (H3, H4). These levels indicate areas where the price is likely to reverse, offering opportunities for profitable trades.
Step 1: Determine the Market Condition
Before applying the Camarilla levels, it’s essential to assess the overall market condition. Is the market trending, or is it in consolidation? Understanding the current price action helps traders decide whether to look for breakout opportunities or wait for price reversals.
Step 2: Trade on Breakouts or Bounces
- Breakouts: When the price breaks above resistance (H3 or H4), this could signal the beginning of a new uptrend. Traders may enter long positions when the price sustains above these levels.
- Bounces: Conversely, if the price bounces from a support level (L3 or L4), it could signal a potential reversal upward. Traders may consider entering long positions near these levels.
Step 3: Use Additional Indicators for Confirmation
To improve the reliability of signals generated by Camarilla Pivot Points, many traders combine them with other technical analysis tools. For example:
- Volume Indicators: A spike in volume can confirm that a breakout is genuine.
- Oscillators: Tools like RSI or Stochastic can be used to spot overbought or oversold conditions, enhancing decision-making.
Advantages and Disadvantages of Camarilla Pivot Points
Advantages
- Accuracy: Camarilla Pivot Points are often more accurate than standard pivot points due to their emphasis on volatility and price ranges.
- Relevance in High-Volatility Markets: These levels are particularly effective in markets with high volatility, such as forex or cryptocurrency, where price swings are larger.
- Clear Support and Resistance Levels: The system provides clear levels for traders to act upon, reducing the ambiguity in decision-making.
Disadvantages
- False Signals: Like any technical indicator, Camarilla Pivot Points are not foolproof. In some cases, false breakouts or reversals may occur.
- Need for Additional Filtering: Traders often use additional indicators or filters to minimize false signals, which can complicate trading strategies.
Camarilla Pivot Points Across Different Timeframes
One of the key strengths of Camarilla Pivot Points is their flexibility across different timeframes. Whether you’re a day trader, a scalper, or a longer-term investor, you can adapt the Camarilla method to suit your trading style.
- Short Timeframes: On shorter timeframes (such as 5-minute charts), Camarilla levels can provide rapid signals for intraday trades.
- Longer Timeframes: On daily or weekly charts, Camarilla Pivot Points can help identify longer-term support and resistance levels, useful for swing traders and investors.
Adapting for Different Trading Styles
- Day Trading: Day traders may focus on tight ranges and breakouts using the Camarilla system for quick entries and exits.
- Swing Trading: Swing traders may use the broader support and resistance levels (H3, L3) for more extended trades based on trend reversals.
- Long-Term Positions: For longer-term positions, traders may look at daily Camarilla levels to spot key price zones for entering or exiting positions.
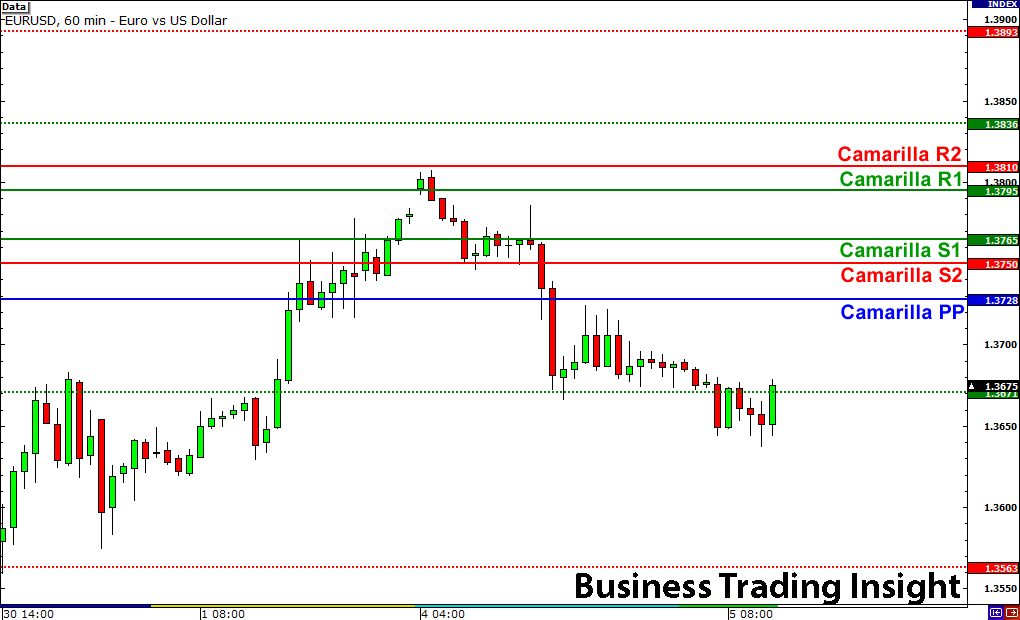
Examples of Trading with Camarilla Pivot Points
Let’s consider an example of using Camarilla Pivot Points in a real trade. Assume that the previous day’s high, low, and close prices are $150, $145, and $147, respectively.
- Calculate the pivot:
P = ( 150 + 145 + 147 ) / 3 =147.33
- Calculate the resistance and support levels:
H3 = 147.33 + ( 5 × 1.1 ) = 152.83 H4 = 147.33 + ( 5 × 1.5 ) = 154.83
L3 = 147.33 − ( 5 × 1.1) = 141.83 L4 = 147.33 − ( 5 × 1.5 ) = 139.83
With these calculated levels, traders can monitor price action. If the price breaks above 152.83 (H3), it could signal a potential long position. Conversely, if the price falls below 141.83 (L3), it might indicate a shorting opportunity.
Comparison with Other Types of Pivot Points
There are several methods for calculating pivot points, each with its unique characteristics.
- Standard Pivot Points: These are calculated using a simple formula based on the previous day’s high, low, and close prices. While useful, they are less nuanced than the Camarilla system, which considers volatility.
- Fibonacci Pivot Points: These use Fibonacci retracement levels to calculate support and resistance levels. While effective, they don’t provide the same detailed set of levels that the Camarilla method offers.
In contrast, Camarilla Pivot Points are more sensitive to market conditions and provide a wider range of levels that can accommodate different trading styles.
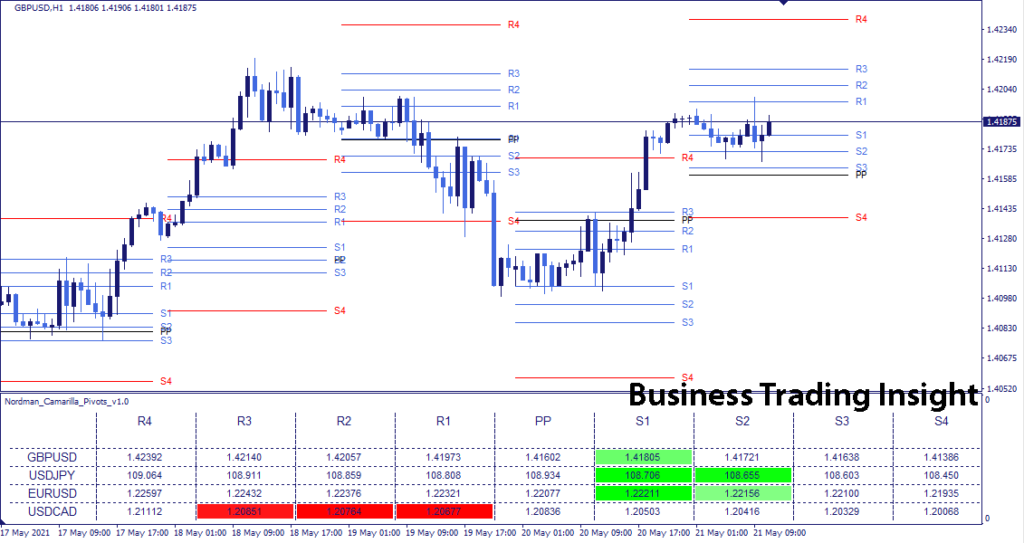
Tips for Improving Trading with Camarilla Pivot Points
- Combine with Other Technical Indicators: Use tools like moving averages or RSI to confirm price action at key Camarilla levels.
- Effective Risk Management: Always use stop-loss orders to protect against false breakouts.
- Minimize False Signals: Filter out signals by looking for volume confirmation or price action patterns at key levels.
Conclusion: Making the Most of Camarilla Pivot Points in Your Trading Strategy
Camarilla Pivot Points are a powerful tool for traders who want to navigate volatile markets with precision. By providing clear levels of support and resistance, this method helps traders identify potential turning points and capitalize on price movements. However, like all technical indicators, Camarilla Pivot Points require careful use and may be most effective when combined with other tools.
The key to successful trading with Camarilla Pivot Points is understanding their calculation, application, and adaptability across different timeframes. Whether you’re a short-term trader looking for breakouts or a longer-term investor seeking major support levels, Camarilla Pivot Points can offer valuable insights into the market’s price action.
By integrating this method into your trading strategy and continuously refining your approach, you can unlock new opportunities and improve your trading performance.
FAQ
How do I use Camarilla Pivot Points in trading?
The main strategy is to buy near support levels (L3, L4) and sell near resistance levels (H3, H4). These levels are considered reversal points, where the price may significantly change direction, providing traders with an opportunity to profit from short-term price movements.
What are the advantages of Camarilla Pivot Points over standard pivots?
Camarilla Pivot Points are more sensitive to market volatility, making them more accurate for trading in fast-moving markets. Unlike standard pivots, which only account for open, close, and high prices, Camarilla levels provide additional levels for a more detailed analysis.
What are the risks of using Camarilla Pivot Points?
Like any indicator, Camarilla Pivot Points are not foolproof. There can be false breakouts or reversals, especially in trending markets. To reduce risks, traders often combine these levels with other tools, such as volume or oscillators, for confirmation.
What’s the difference between Camarilla Pivot Points and Fibonacci Pivot Points?
Camarilla Pivot Points are based on market volatility, offering more precise levels for short-term trading, while Fibonacci Pivot Points use Fibonacci retracement levels to calculate support and resistance. Camarilla provides a broader set of levels, making it more versatile for different trading strategies.

