In the realm of technical analysis, understanding bullish vs bearish engulfing patterns is crucial for traders aiming to predict future price movements. Among the myriad of candlestick patterns available, these two stand out for their significance in indicating potential reversals. The bullish engulfing pattern suggests a shift toward buying pressure, while the bearish engulfing pattern indicates potential selling pressure. Grasping the nuances of these patterns is essential for making informed trading decisions, as they provide valuable insights into market sentiment and possible price shifts. This article delves deeply into both patterns, examining their characteristics, psychological implications, effective trading strategies, and potential risks, supported by real-world examples.
What Is a Bullish Engulfing Pattern?
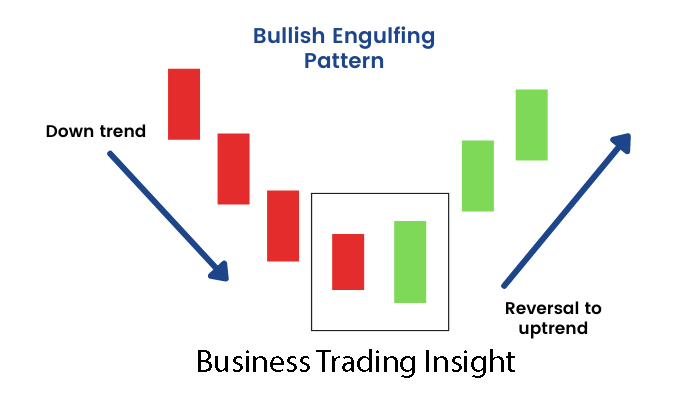
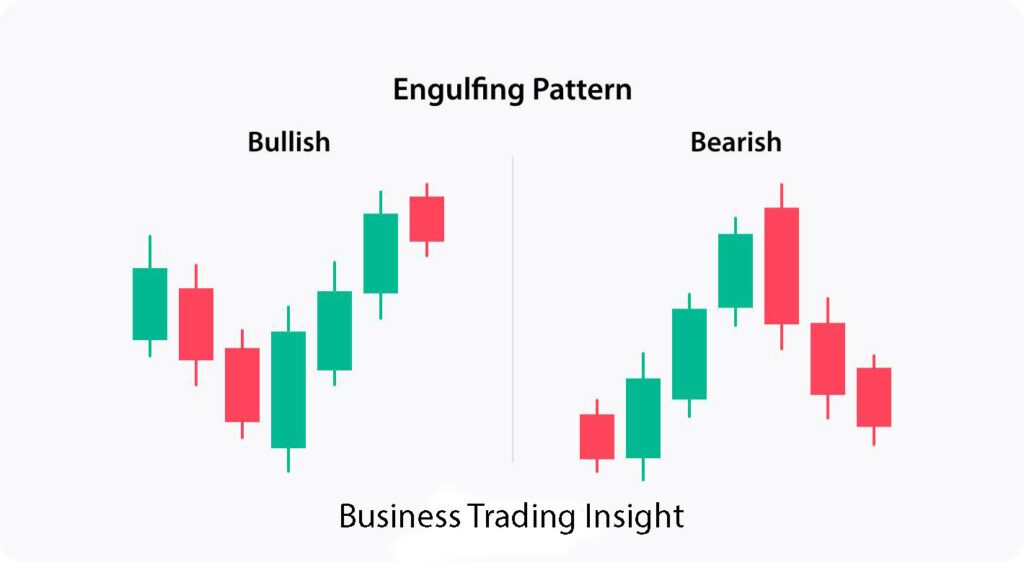
A bullish engulfing pattern is a two-candle formation that typically appears at the end of a downtrend. It consists of a small bearish candle followed by a larger bullish candle that completely engulfs the first one. This pattern indicates that buyers are stepping in, potentially signaling the start of an upward price movement.
Key Characteristics of Bullish Engulfing Pattern
- Candle Structure: The first candle is small and bearish, reflecting seller dominance, while the second candle is larger and bullish, demonstrating strong buying interest. The body of the second candle should be longer than that of the first.
- Location: The pattern is most effective when it forms at the bottom of a downtrend or near significant support levels, making it a reliable signal for a potential reversal.
- Volume: High trading volume accompanying the second candle enhances the reliability of the pattern. A significant increase in volume suggests strong participation from buyers, lending credibility to the reversal signal.

Historical Example of Bullish Engulfing Pattern
A notable historical example of the bullish engulfing pattern occurred in the stock of Apple Inc. in March 2020. Following a significant decline due to market reactions to the COVID-19 pandemic, Apple shares dropped from approximately $325 to $250. On March 23, a small bearish candle was followed by a larger bullish candle on March 24 that completely engulfed the previous candle. This pattern emerged near a critical support level, and subsequent bullish movement led Apple’s stock to rally to over $400 within a few months, demonstrating the efficacy of the bullish engulfing pattern in signaling reversals.
What Is a Bearish Engulfing Pattern?
Conversely, a bearish engulfing pattern signals a potential reversal at the end of an uptrend. This pattern consists of a small bullish candle followed by a larger bearish candle that fully engulfs the first one. It suggests that sellers are gaining control of the market, potentially leading to a downward price movement.
Key Characteristics of Bearish Engulfing Pattern
- Candle Structure: The first candle is small and bullish, indicating buyer dominance, while the second candle is larger and bearish, signaling that sellers have overwhelmed buyers.
- Location: This pattern is most effective when found at the top of an uptrend or near recognized resistance levels, making it a potent indicator of a potential price reversal.
- Volume: As with the bullish engulfing pattern, high volume on the second bearish candle reinforces the reliability of the signal. Increased volume indicates strong selling pressure and commitment from traders.
Historical Example of Bearish Engulfing Pattern
A classic example of a bearish engulfing pattern occurred in the stock of Tesla Inc. in early 2021. After reaching an all-time high of around $900 in January, Tesla shares exhibited a bullish candle on January 27, followed by a bearish engulfing candle on January 28. This engulfing pattern signaled a potential reversal, and in the weeks that followed, Tesla’s stock price declined significantly, illustrating how the bearish engulfing pattern can effectively signal shifts in market sentiment.
Psychological Implications of Engulfing Patterns
Understanding the psychology behind these patterns can greatly enhance their predictive power:
- Bullish Engulfing: The first candle reflects seller dominance, creating a sense of pessimism in the market. When the second candle appears, it signals a shift in sentiment as buyers aggressively enter the market. This shift often arises from fundamental news, positive earnings reports, or favorable economic indicators that can inspire confidence among traders.
- Bearish Engulfing: Conversely, the bullish first candle reflects market optimism. However, when the bearish candle appears, it suggests that sellers have regained control, leading to potential downward pressure on prices. This reversal can often be triggered by negative news or earnings reports that surprise the market.
Traders’ emotions — such as fear and greed — play a crucial role in the formation of these patterns. Fear can lead to increased selling pressure, while greed may cause buyers to enter the market aggressively. By understanding these emotional drivers, traders can better anticipate potential reversals.
Trading Strategies for Bullish vs Bearish Engulfing Patterns
To effectively trade using engulfing patterns, traders should employ strategies tailored to both bullish and bearish formations that enhance accuracy and profitability.
For Bullish Engulfing Patterns
- Confirm the Pattern: Ensure the second candle fully engulfs the first and is supported by high trading volume. Look for additional confirmation through subsequent bullish candles or indicators like RSI or MACD, which can provide further validation of the bullish signal.
- Set Entry and Exit Points: Place a buy order above the high of the bullish engulfing candle. It’s advisable to set a stop-loss just below the low of the engulfing candle to protect against potential losses.
- Use Additional Indicators: Incorporate other technical indicators, such as moving averages or trend lines, to reinforce your analysis. For instance, if the bullish engulfing pattern occurs near a significant moving average, it may provide additional confidence in the potential reversal.
For Bearish Engulfing Patterns
- Confirm the Pattern: Ensure the second candle fully engulfs the first with high volume to validate the bearish signal. Additional confirmation can come from follow-up bearish candles or indicators like the Average True Range (ATR), which measures market volatility.
- Set Entry and Exit Points: Place a sell order below the low of the bearish engulfing candle, and set a stop-loss above its high. This strategy helps manage risk while allowing for potential profit.
- Combine with Other Analysis: Use trend analysis or fundamental data to support your trading decision. For example, if the bearish engulfing pattern coincides with negative earnings forecasts, it adds weight to the reversal signal.
By understanding and applying these strategies for both bullish and bearish engulfing patterns, traders can improve their decision-making and enhance their overall trading performance.
Limitations of Using Engulfing Patterns
While both bullish and bearish engulfing patterns are powerful tools, they have inherent limitations that traders should be aware of:
- False Signals: Both patterns can produce misleading signals, particularly in volatile or choppy markets. Traders should always use additional confirmation tools, such as trend analysis or indicators, to validate the patterns.
- Market Conditions: The effectiveness of engulfing patterns can vary based on broader market trends. A bullish engulfing pattern in a strong downtrend may not lead to a reversal, and vice versa. Always consider the overall market context when interpreting these patterns.
- Time Frame Sensitivity: Patterns may appear differently across various time frames. A bullish or bearish engulfing pattern on a daily chart may hold different significance than one on shorter time frames, such as hourly or 15-minute charts. This variability can lead to different interpretations and outcomes.
- Psychological Factors: Market psychology can also impact the reliability of these patterns. External events, news releases, or economic data can lead to sudden price movements that invalidate the patterns, making it crucial for traders to stay informed.
Summary Table of Engulfing Patterns
| Pattern Type | Key Characteristics | Trading Strategies | Historical Example |
|---|---|---|---|
| Bullish Engulfing | Small bearish candle followed by a larger bullish candle. Forms at the end of a downtrend with high volume. | Confirm engulfing nature, set buy orders above the high, and use stop-loss below the low. | Apple Inc. in March 2020. |
| Bearish Engulfing | Small bullish candle followed by a larger bearish candle. Forms at the end of an uptrend with high volume. | Confirm engulfing nature, set sell orders below the low, and use stop-loss above the high. | Tesla Inc. in January 2021. |
Discussion of Risks
Both bullish and bearish engulfing patterns come with risks that traders must manage carefully. False breakouts, market noise, and sudden price shifts can lead to erratic movements, making it essential to employ robust risk management techniques. Utilizing stop-loss orders, diversifying your trades, and remaining informed about market news and events can help mitigate potential losses and navigate unexpected volatility.
Bullish and bearish engulfing patterns is vital for traders looking to capitalize on potential market reversals. By analyzing their characteristics, psychological implications, and potential risks, along with employing effective trading strategies, traders can enhance their technical analysis skills and make informed decisions in the market.
Key Takeaways
- Identify bullish engulfing patterns at the end of downtrends and bearish engulfing patterns at the end of uptrends.
- Confirm patterns with subsequent bullish or bearish candles and strong volume, utilizing additional indicators for validation.
- Be aware of risks associated with false signals and market conditions, and use clear entry, stop-loss, and take-profit strategies to manage trades effectively.
With diligent practice and a keen eye for detail, both bullish and bearish engulfing patterns can become powerful tools in your trading arsenal, guiding you toward more informed and potentially profitable trades. Start observing charts and look for these crucial signals today!
FAQ
What is a bearish engulfing pattern?
A bearish engulfing pattern occurs at the end of an uptrend. It features a small bullish candle followed by a larger bearish candle that engulfs the first one. This signal suggests that after a period of optimism and buying pressure (the bullish candle), sellers are beginning to take control of the market, which may lead to a decrease in prices. The bearish engulfing pattern is often interpreted as a precursor to a trend reversal or correction, indicating a potential downward movement.
How can I confirm an engulfing pattern?
To confirm an engulfing pattern, it is important to check that the second candle fully engulfs the first and that it is accompanied by high trading volume. High volume at the time of the second candle's formation indicates strong market participation and enhances the reliability of the signal. Additional confirmation can come from subsequent candles that should show a continuation of the trend or from technical indicators, such as RSI or MACD, which can further validate the strength of the movement.
What are the risks of trading engulfing patterns?
Trading based on engulfing patterns carries several risks. Firstly, there can be false signals, where the pattern does not lead to the expected reversal, especially in volatile or unstable markets. Secondly, overall market conditions may invalidate the signals of the engulfing patterns; for instance, if there is a strong trend opposing the pattern. Thirdly, time frame sensitivity may lead to different interpretations of the same pattern on different charts. Lastly, psychological factors such as fear or greed can cause sudden price fluctuations, making it difficult to predict movements. Therefore, it is crucial to use robust risk management techniques, such as setting stop-loss orders and diversifying the portfolio.
Where is the best location for these patterns to form?
Bullish engulfing patterns are most effective when they form at the end of downtrends or near significant support levels, as there is a higher probability that prices will reverse upwards at these points. Conversely, bearish engulfing patterns work best at the end of uptrends or near resistance levels, where the likelihood of a downward reversal is greater. These levels often serve as psychological barriers for traders, and their presence enhances the credibility of the engulfing patterns. Traders should pay attention to market context and technical levels when searching for suitable entry points.

